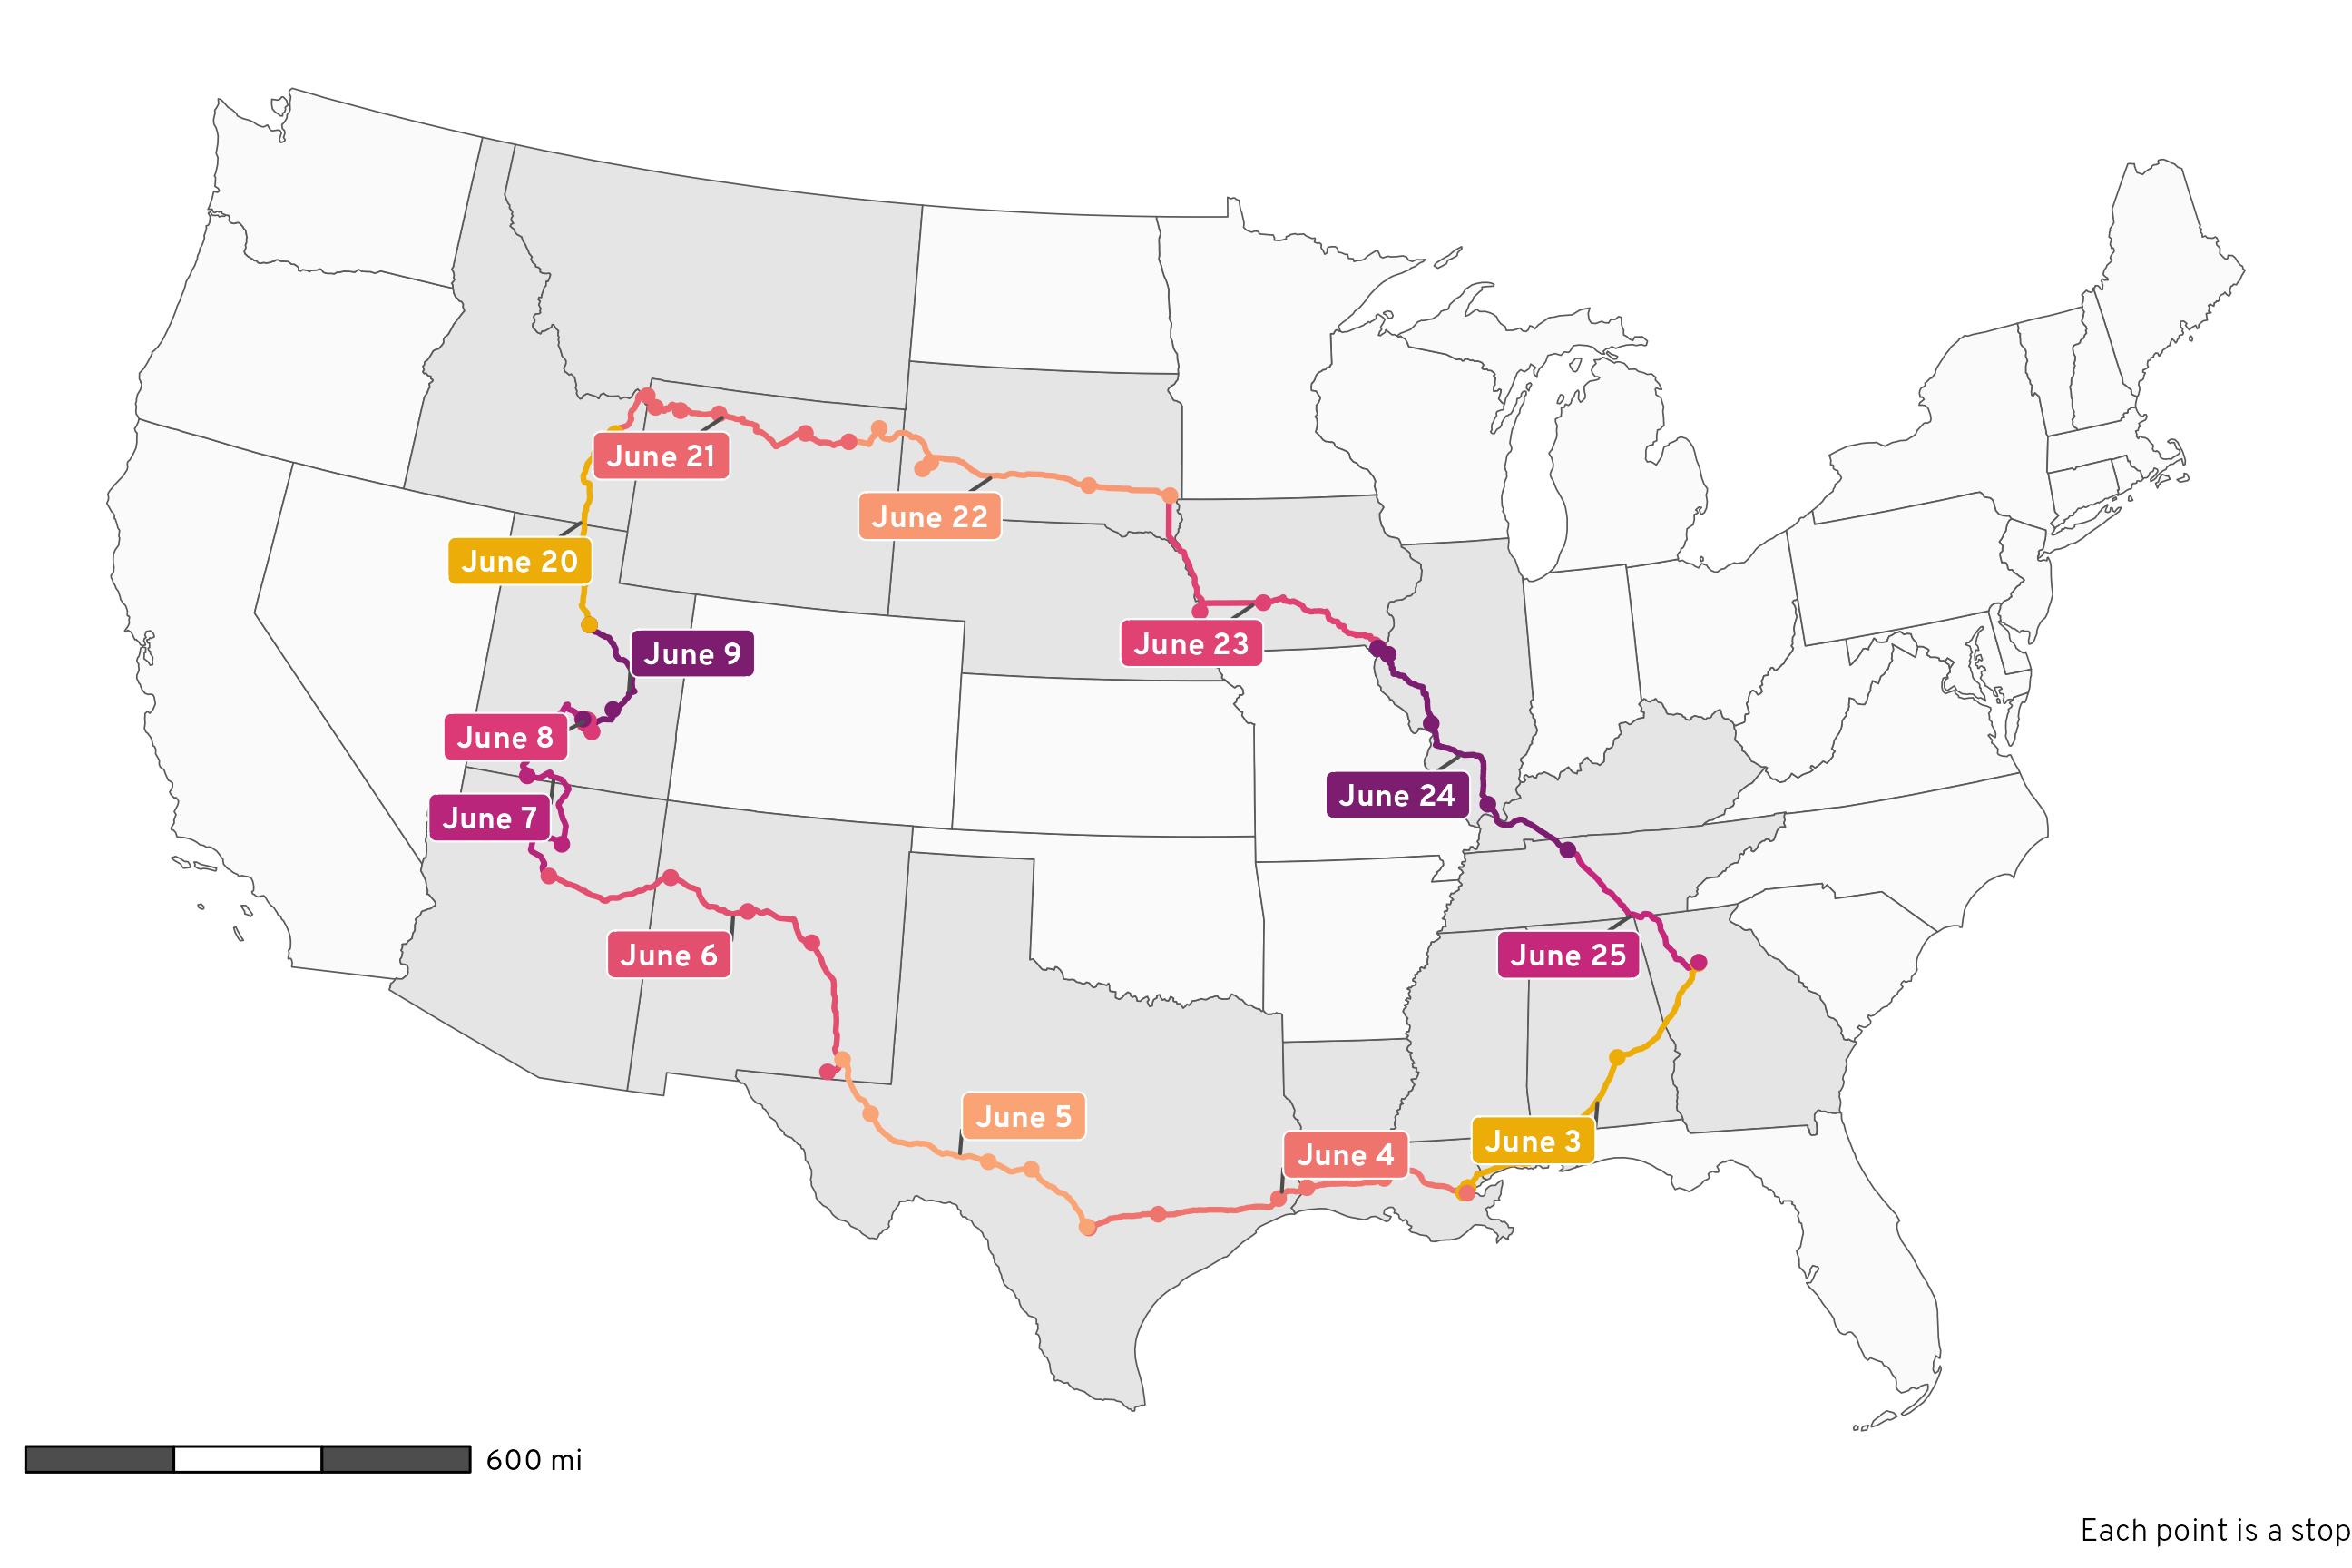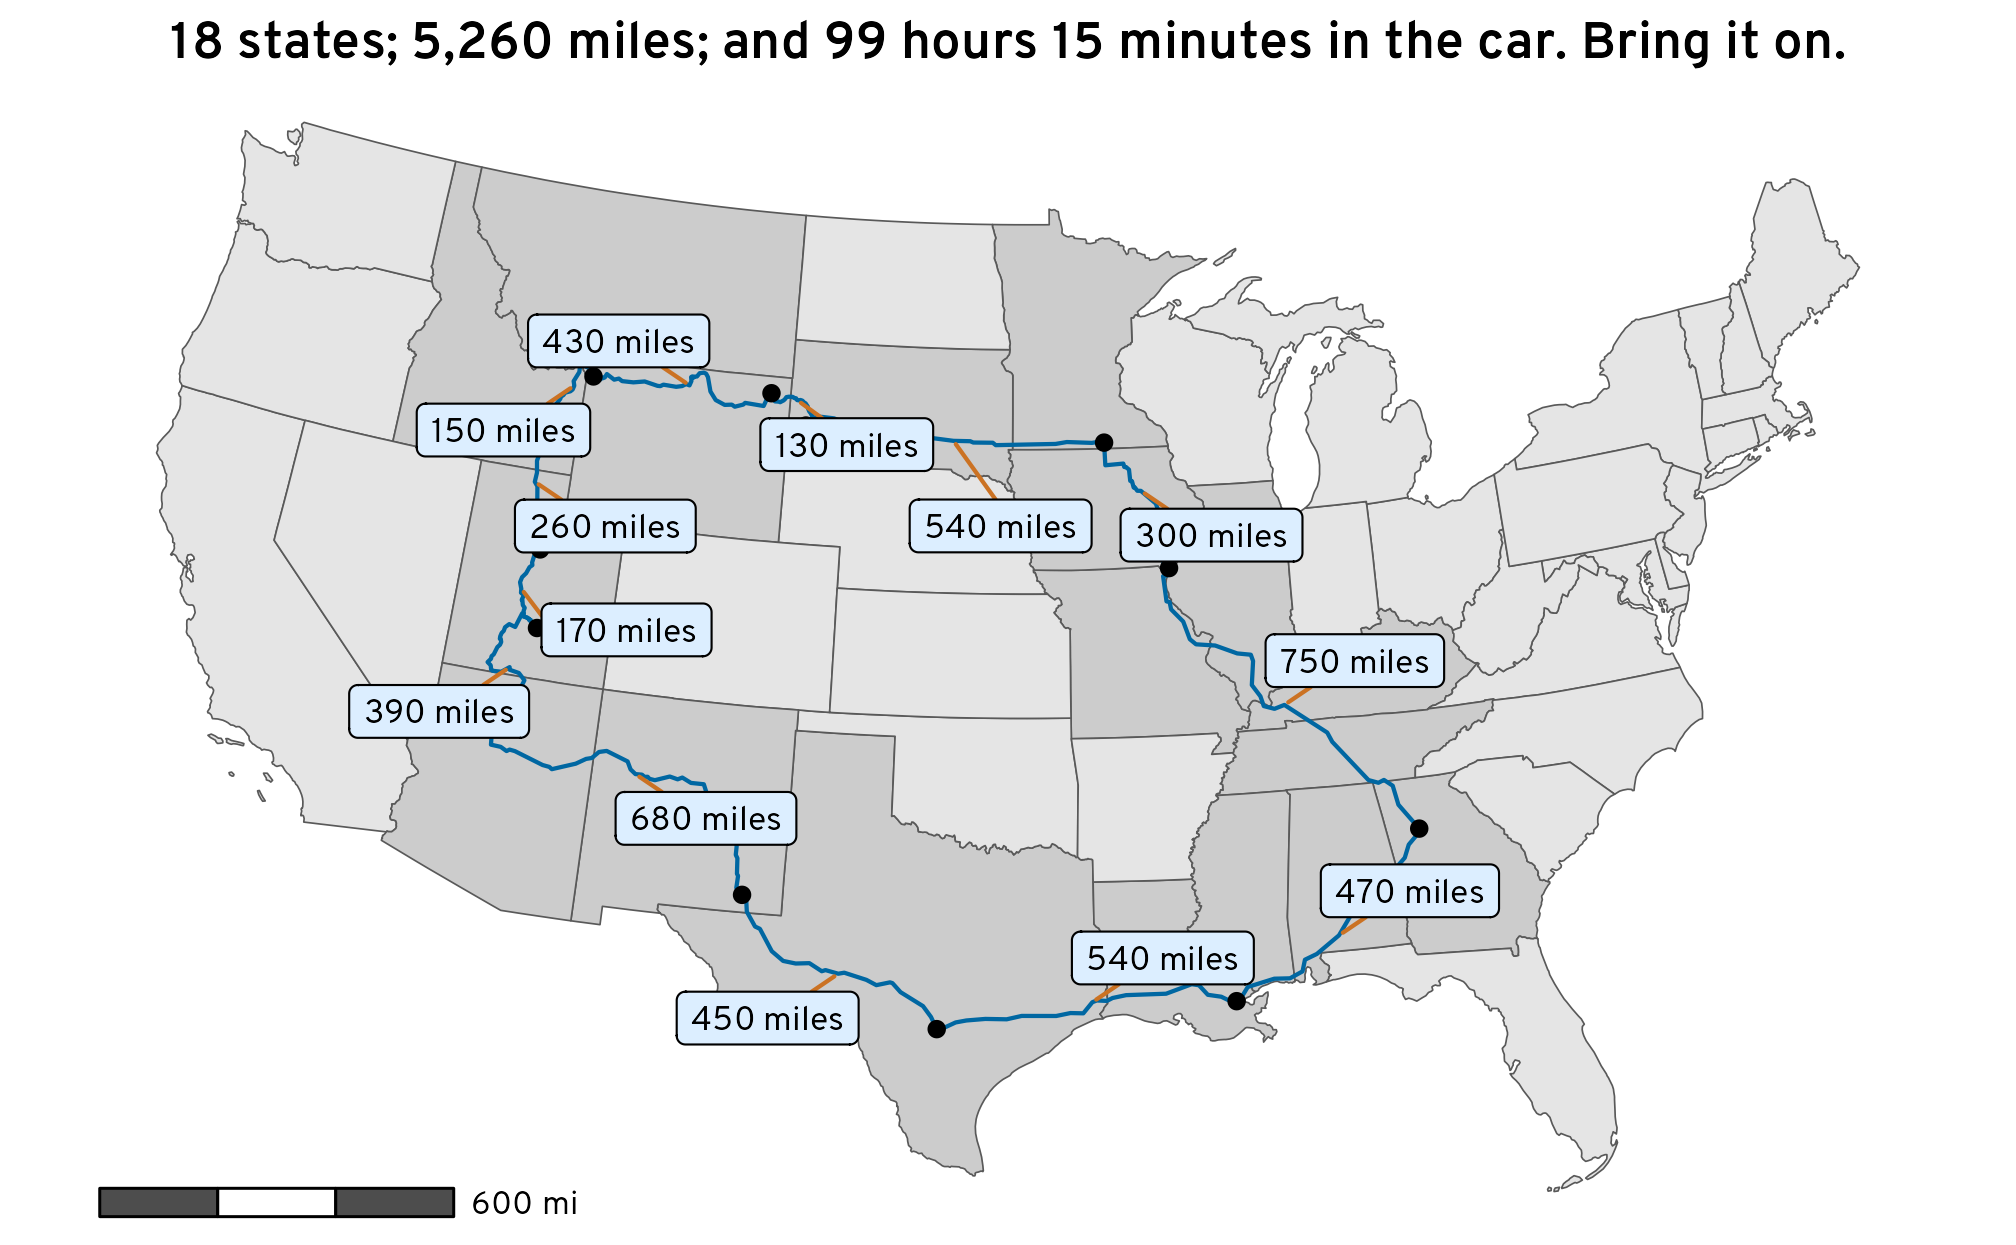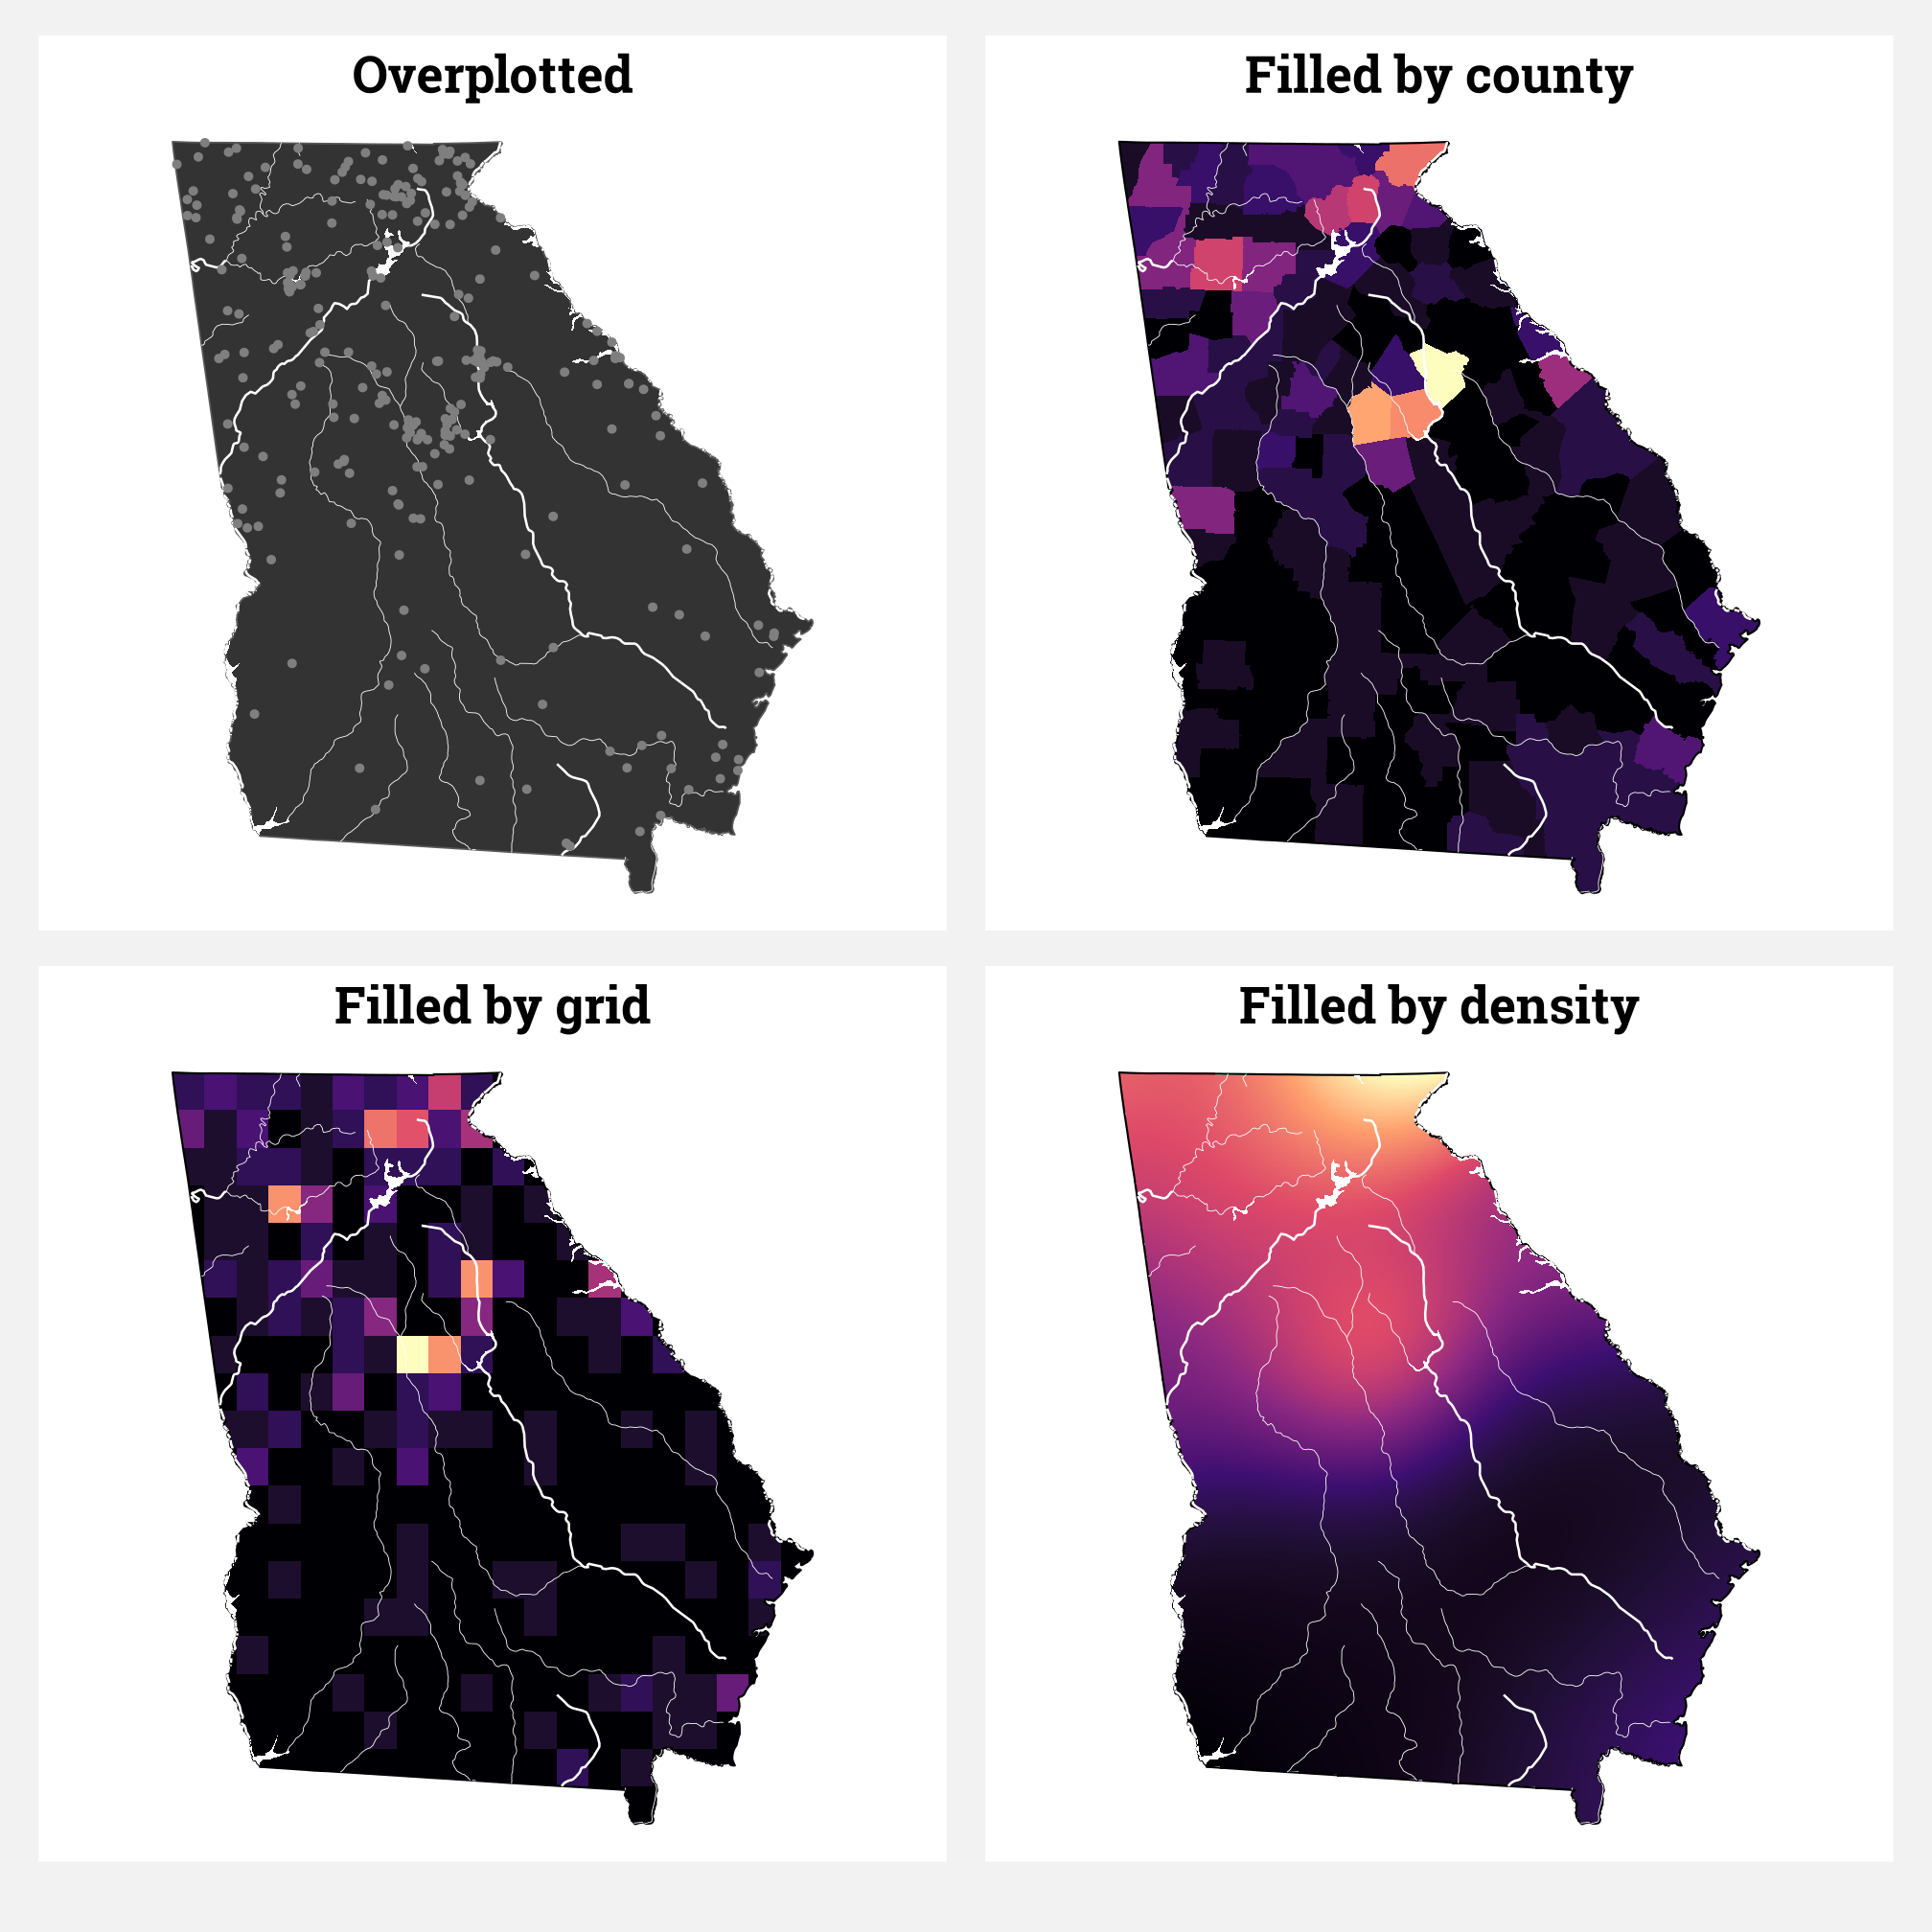
As I explained in my previous blog post, in June 2023 I drove my family across the country in a 5,000-mile roundtrip odyssey from Atlanta, Georgia to just-south-of-Salt Lake City, Utah, and back again.
In a couple days, I’m going to drive across the country to Utah, my home state. I haven’t been out west with my whole family in four years—not since 2019 when we moved from Spanish Fork, Utah to Atlanta, Georgia. According to Google Maps, it’s a mere 1,900 miles (3,000 kilometers) through the middle of the United States and should take 28 hours, assuming no stops.
.magic-block { font-style: normal; user-select: none; padding: 0 0.1em 0 0.15em; line-height: 1; font-size: 120%; } I’ve been working on converting a couple of my dissertation chapters into standalone articles, so I’ve been revisiting and improving my older R code.
I’ve taught a course on data visualization with R since 2017, and it’s become one of my more popular classes, especially since it’s all available asynchronously online with hours of Creative Commons-licensed videos and materials.
In The Two Towers , while talking with Eowyn, Aragorn casually mentions that he’s actually 87 years old. When Aragorn is off running for miles and miles and fighting orcs and trolls and Uruk-hai and doing all his other Lord of the Rings adventures, he hardly behaves like a regular human 87-year-old. How old is he really?
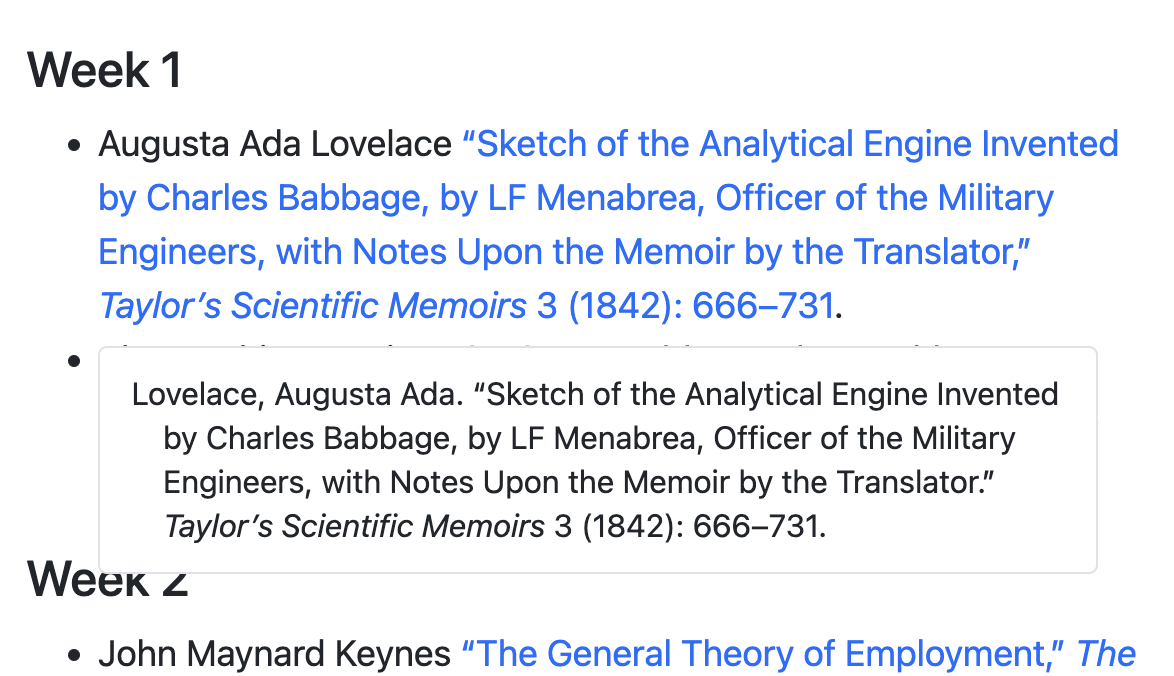
Pandoc-flavored Markdown makes it really easy to cite and reference things. You can write something like this (assuming you use this references.bib BibTeX file): --- title: "Some title" bibliography: references.bib --- According to @Lovelace:1842, computers can calculate things.
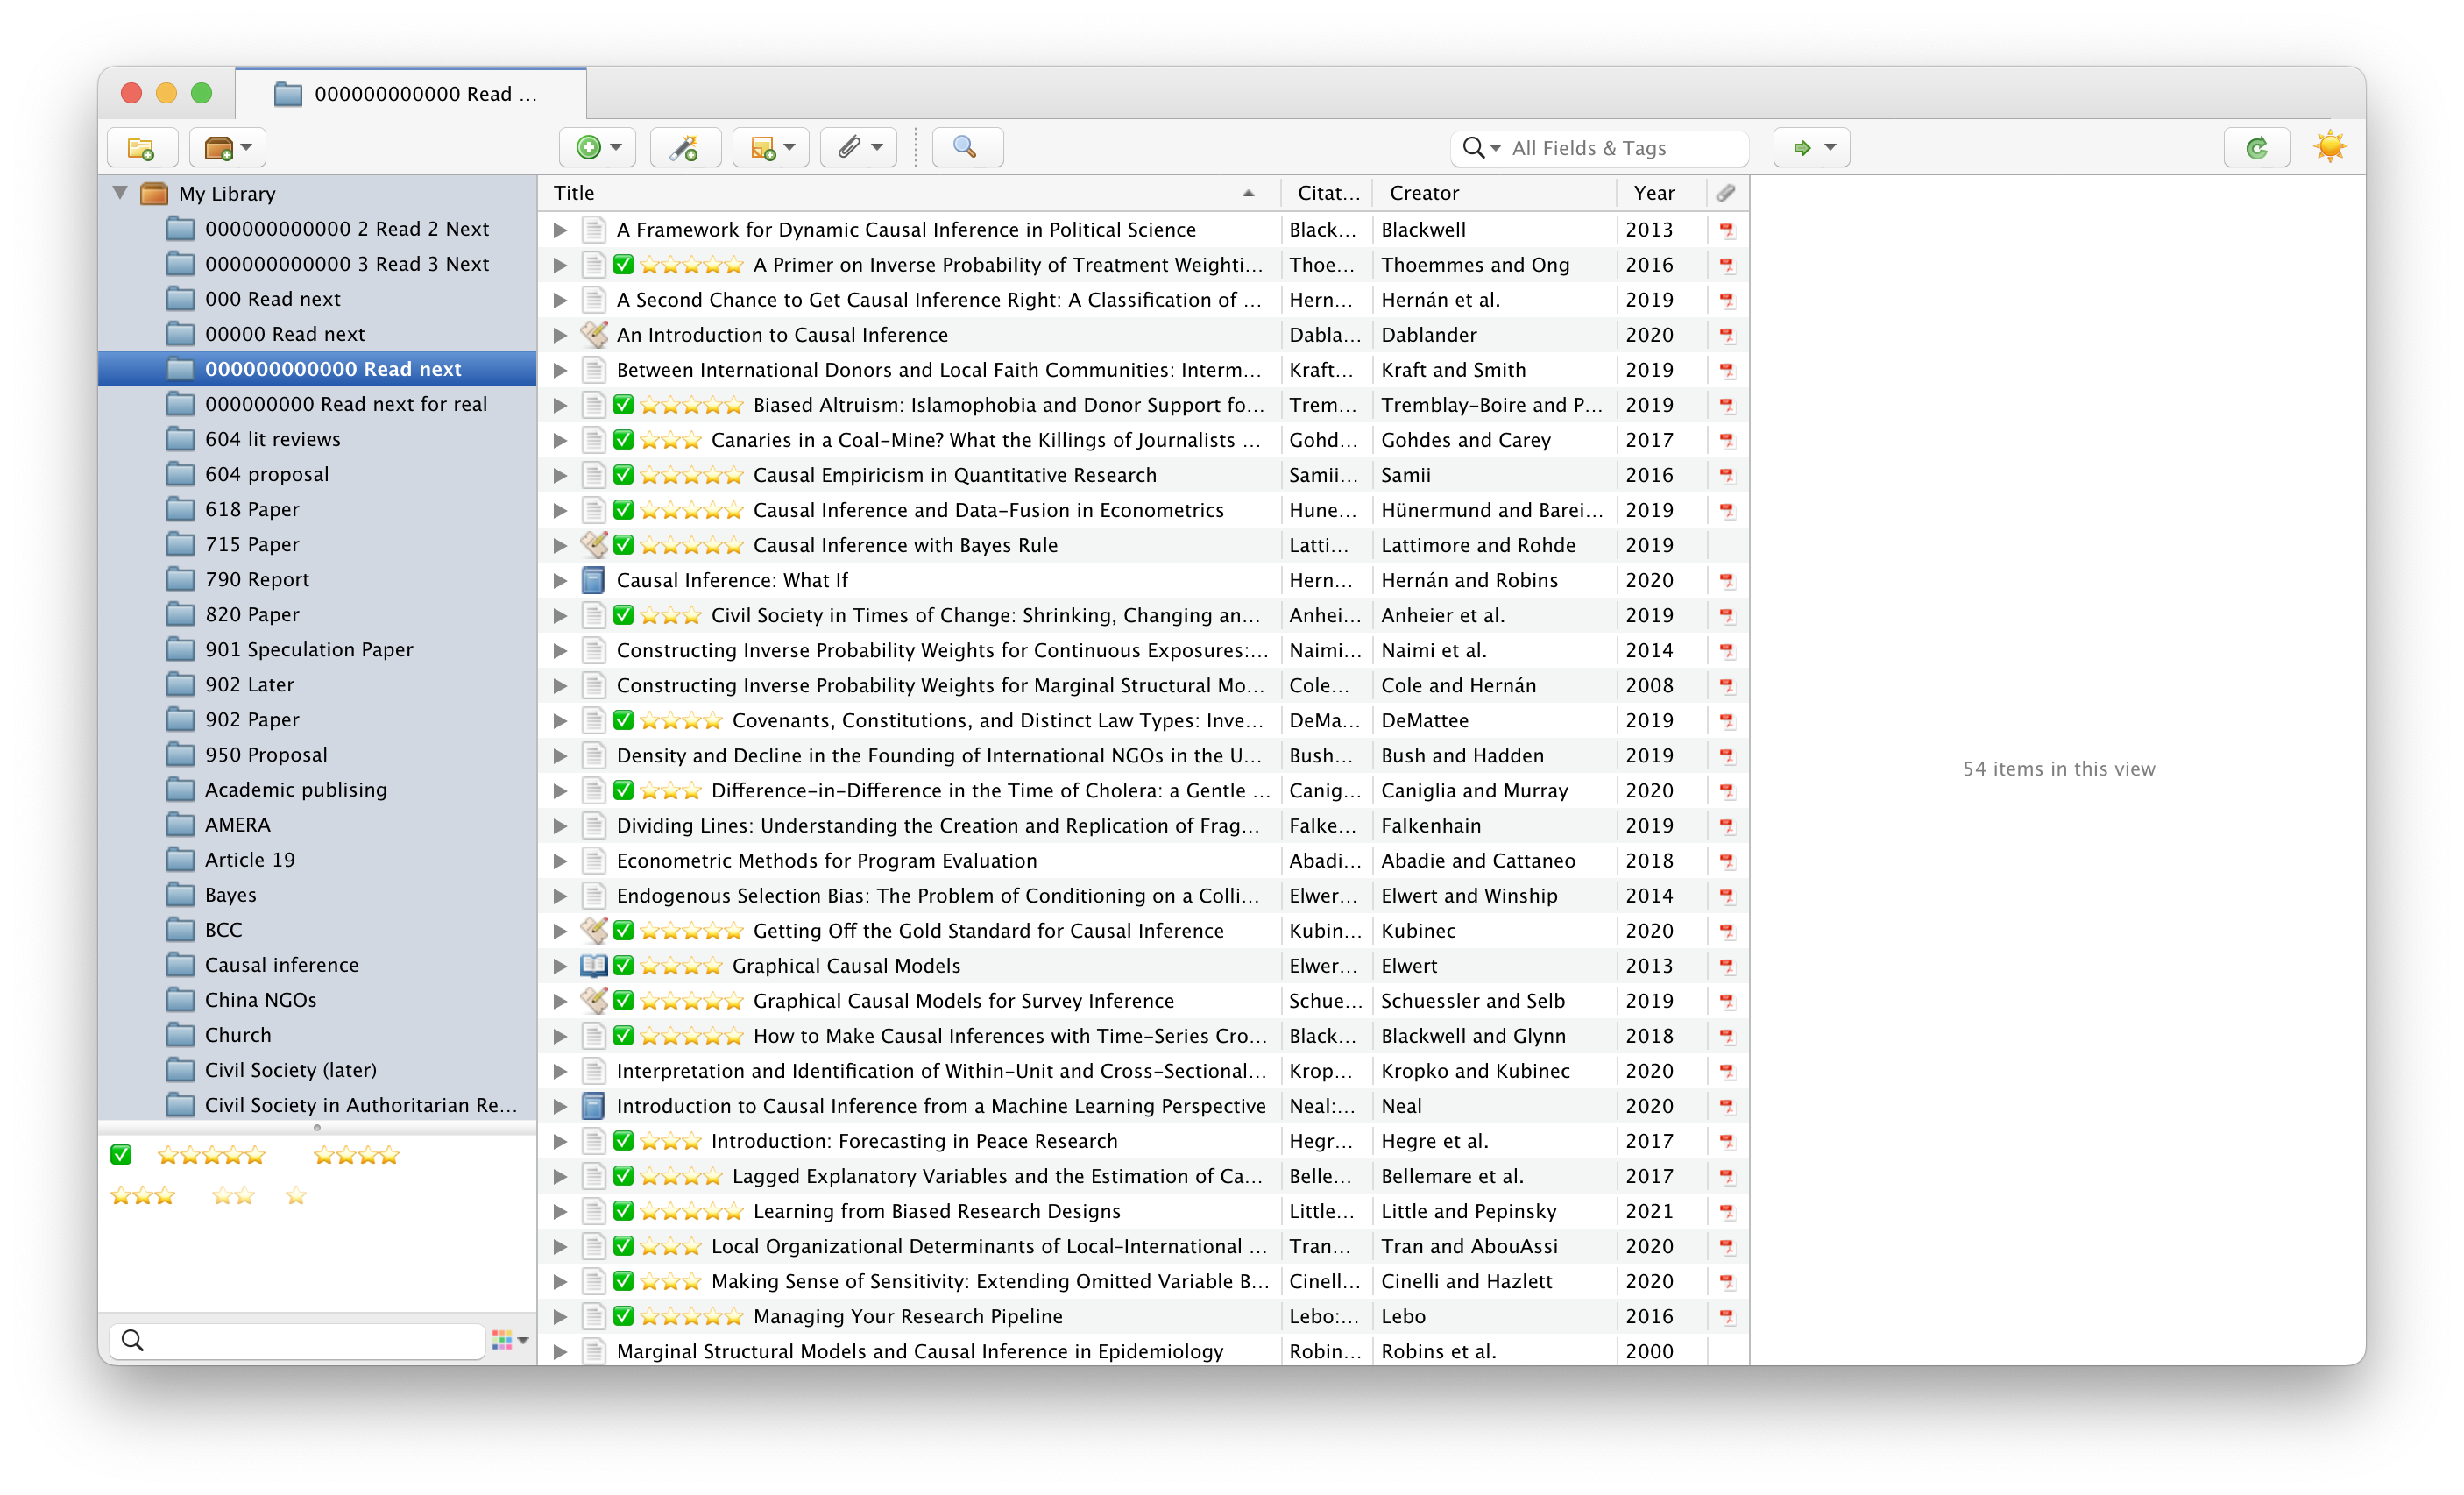
My longstanding workflow for writing, citing, and PDF management When I started my first master’s degree program in 2008, I decided to stop using Word for all my academic writing and instead use plain text Markdown for everything. Markdown itself had been a thing for 4 years, and MultiMarkdown—a pandoc-like extension of Markdown that could handle BibTeX bibliographies—was brand new.
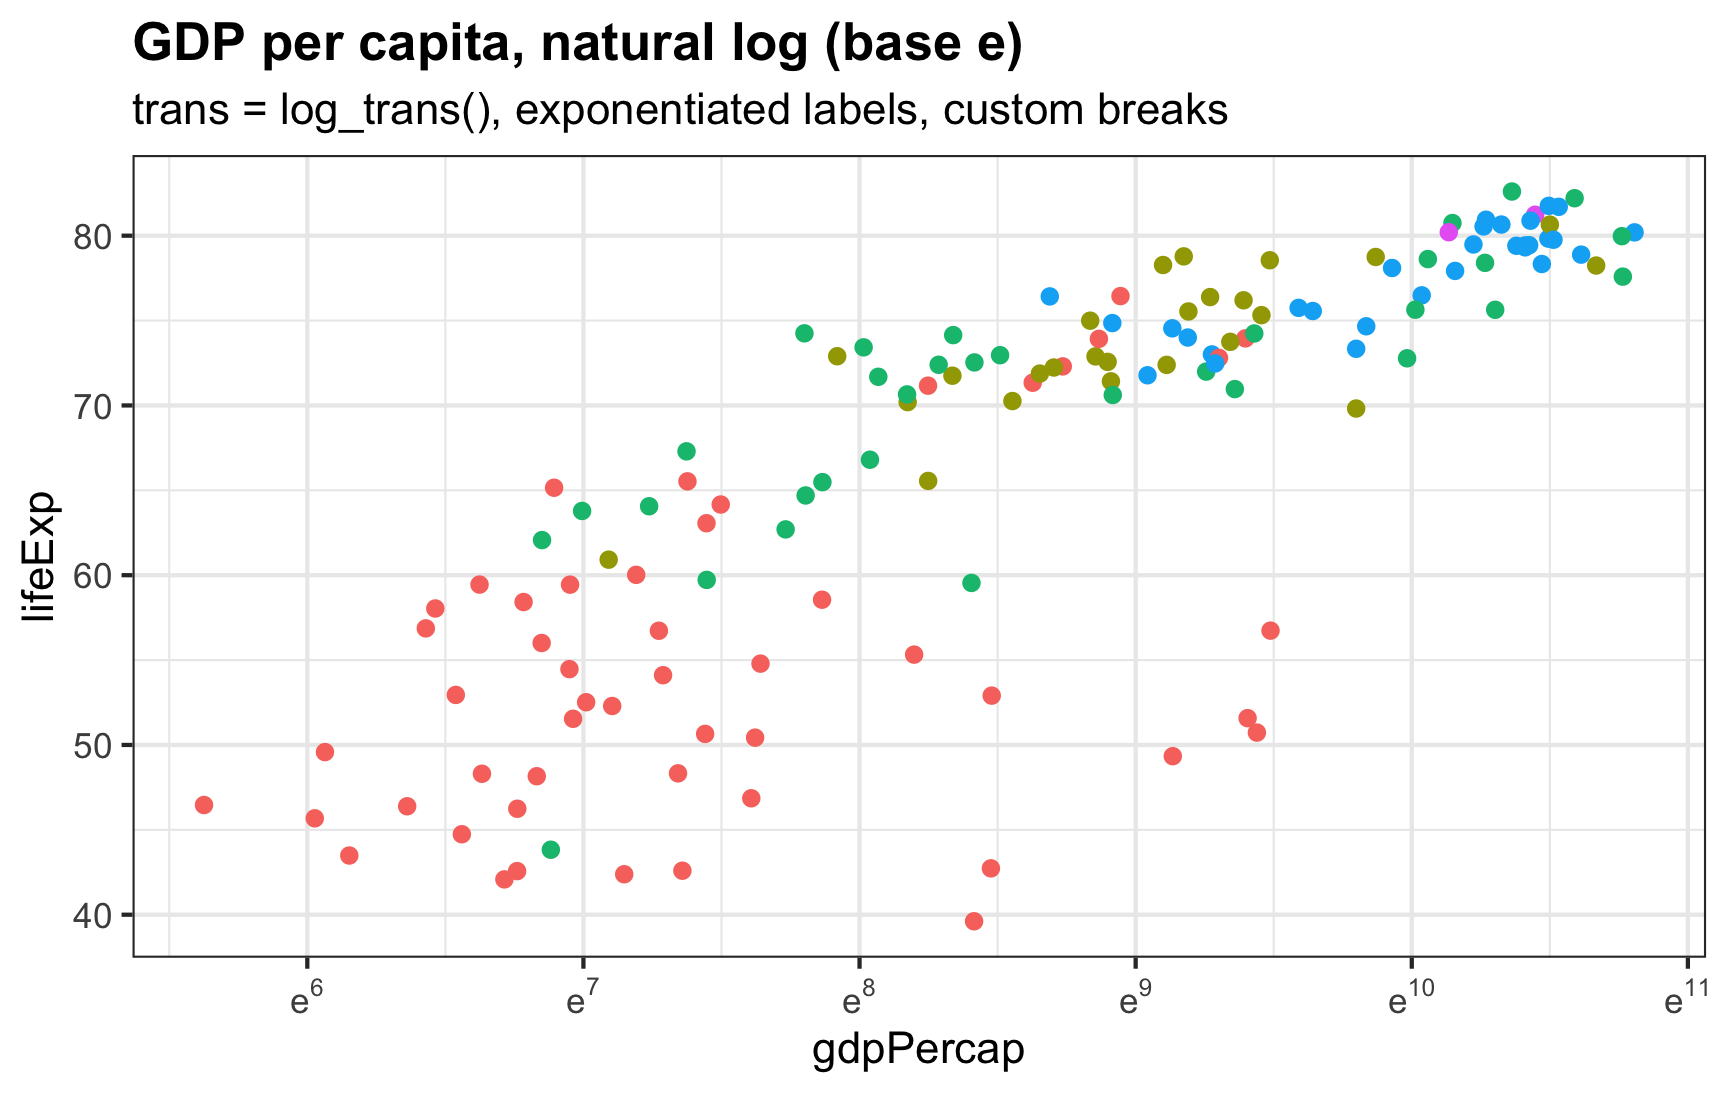
I always forget how to deal with logged values in ggplot—particularly things that use the natural log.
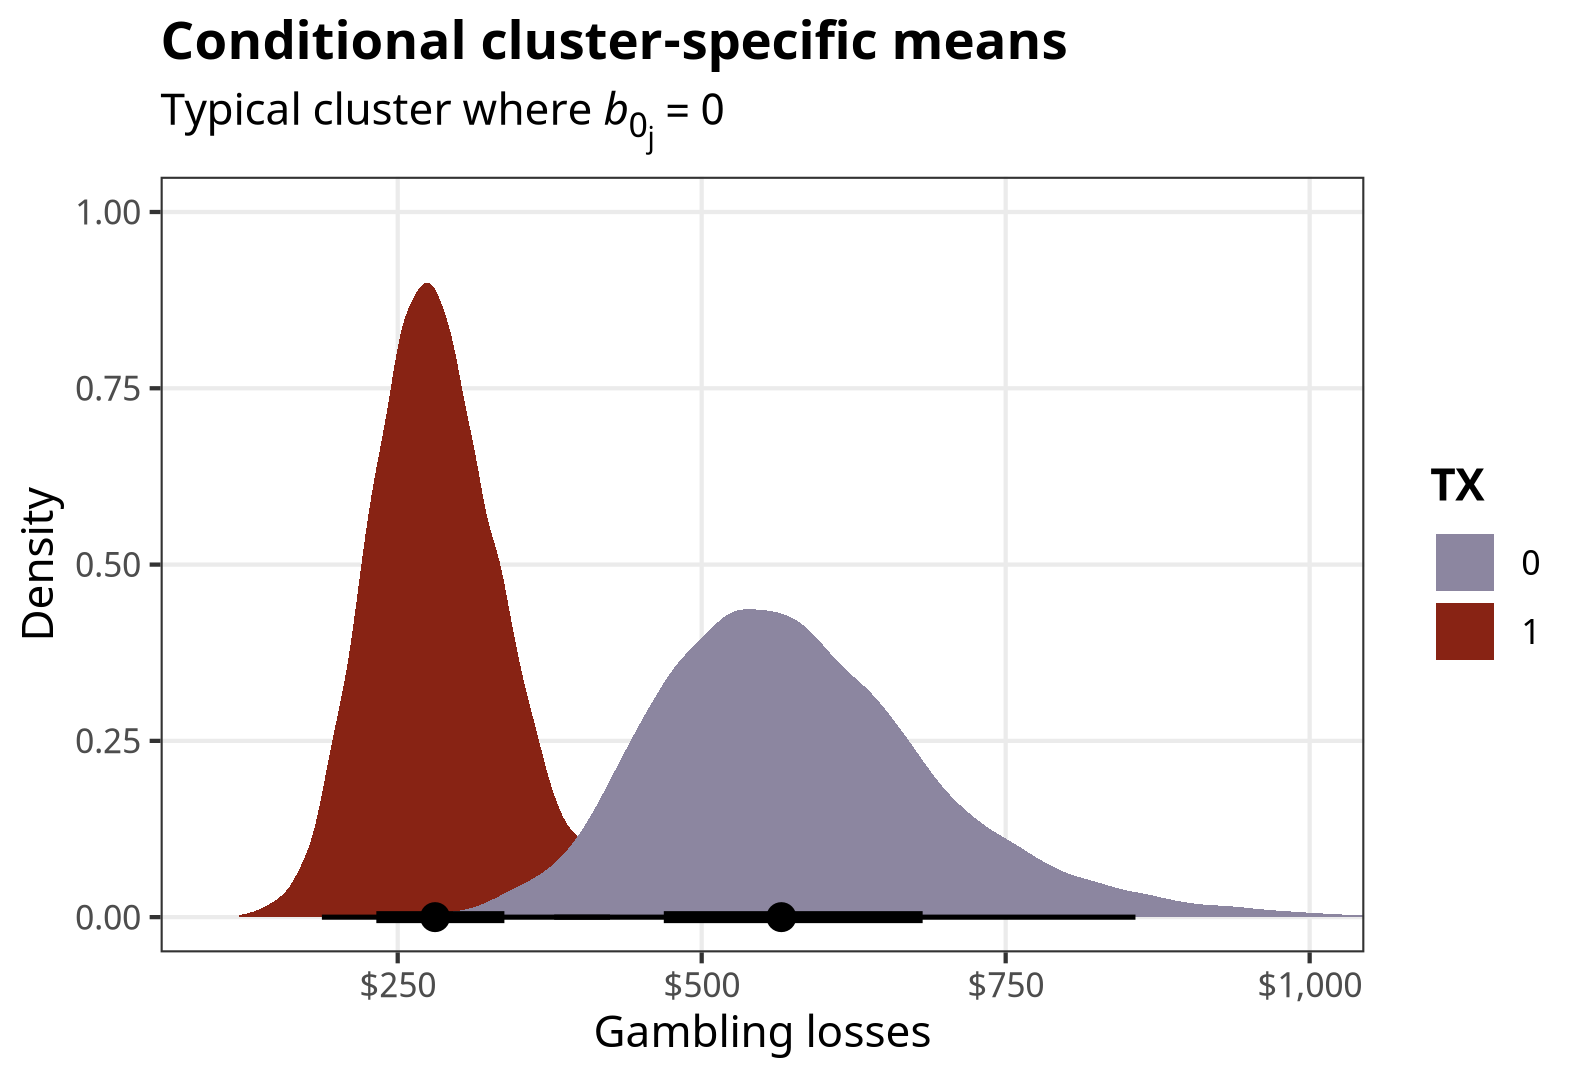
As a field, statistics is really bad at naming things. Take, for instance, the term “fixed effects.” In econometrics and other social science-flavored statistics, this typically refers to categorical terms in a regression model.
Downloadable cheat sheets! You can download PDF, SVG, and PNG versions of the diagrams and cheat sheets in this post, as well as the original Adobe Illustrator and InDesign files, at the bottom of this post Do whatever you want with them!
In one of the assignments for my data visualization class, I have students visualize the number of essential construction projects that were allowed to continue during New York City’s initial COVID shelter-in-place order in March and April 2020. It’s a good dataset to practice visualizing amounts and proportions and to practice with dplyr ’s group_by() and summarize() and shows some interesting trends.