Political ScienceQuarto

Andrew Heiss's blog

Andrew Heiss's blog
Home PageRSS FeedMastodon
language
Published

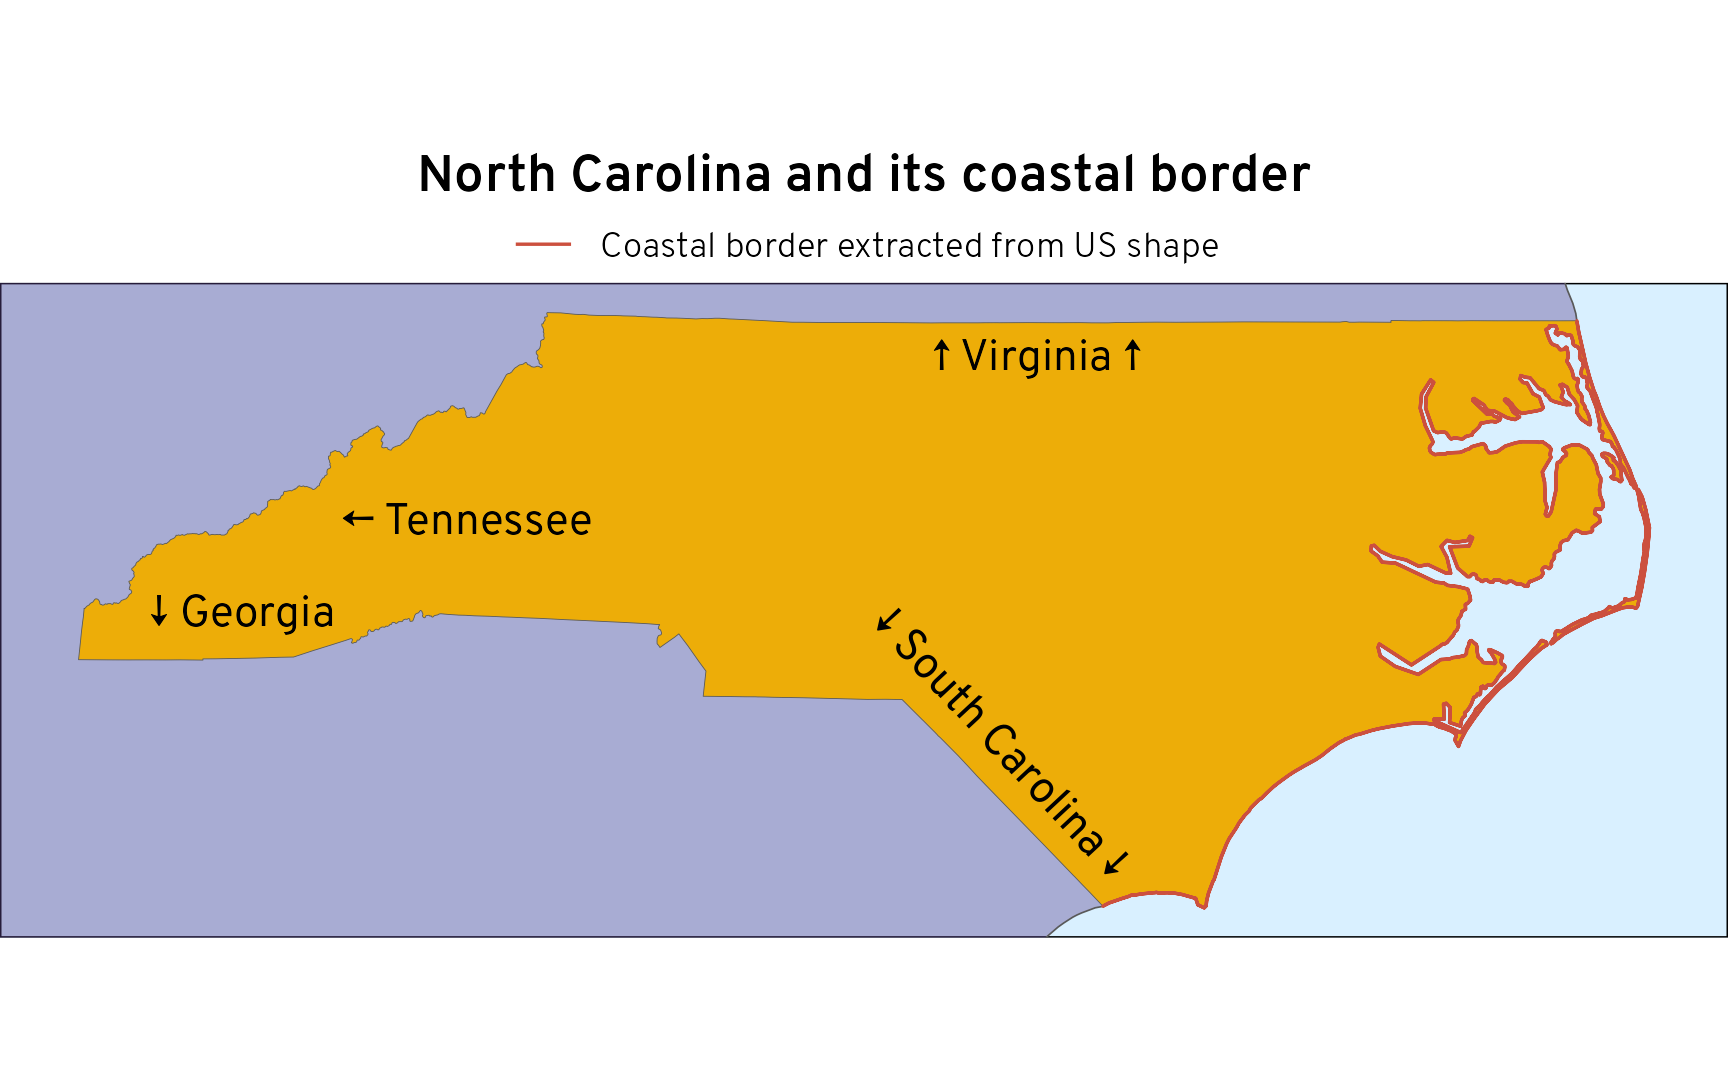
A few days ago, my wife, a bunch of my kids, and I were huddled around a big wall map of the United States, joking about the relative unimportance of Rhode Island, the smallest state in the US. It’s one of the states I never ever think about: …and it’s just so small . Amid the joking, my wife came to Rhode Island’s defense by declaring that even though it’s so small, it has one of the highest proportions of coastline to land borders.

Published

Even though I’ve been teaching R and statistical programming since 2017, and despite the fact that I do all sorts of heavily quantitative research, I’m really really bad at probability math . Like super bad. The last time I truly had to do set theory and probability math was in my first PhD-level stats class in 2012.

Published

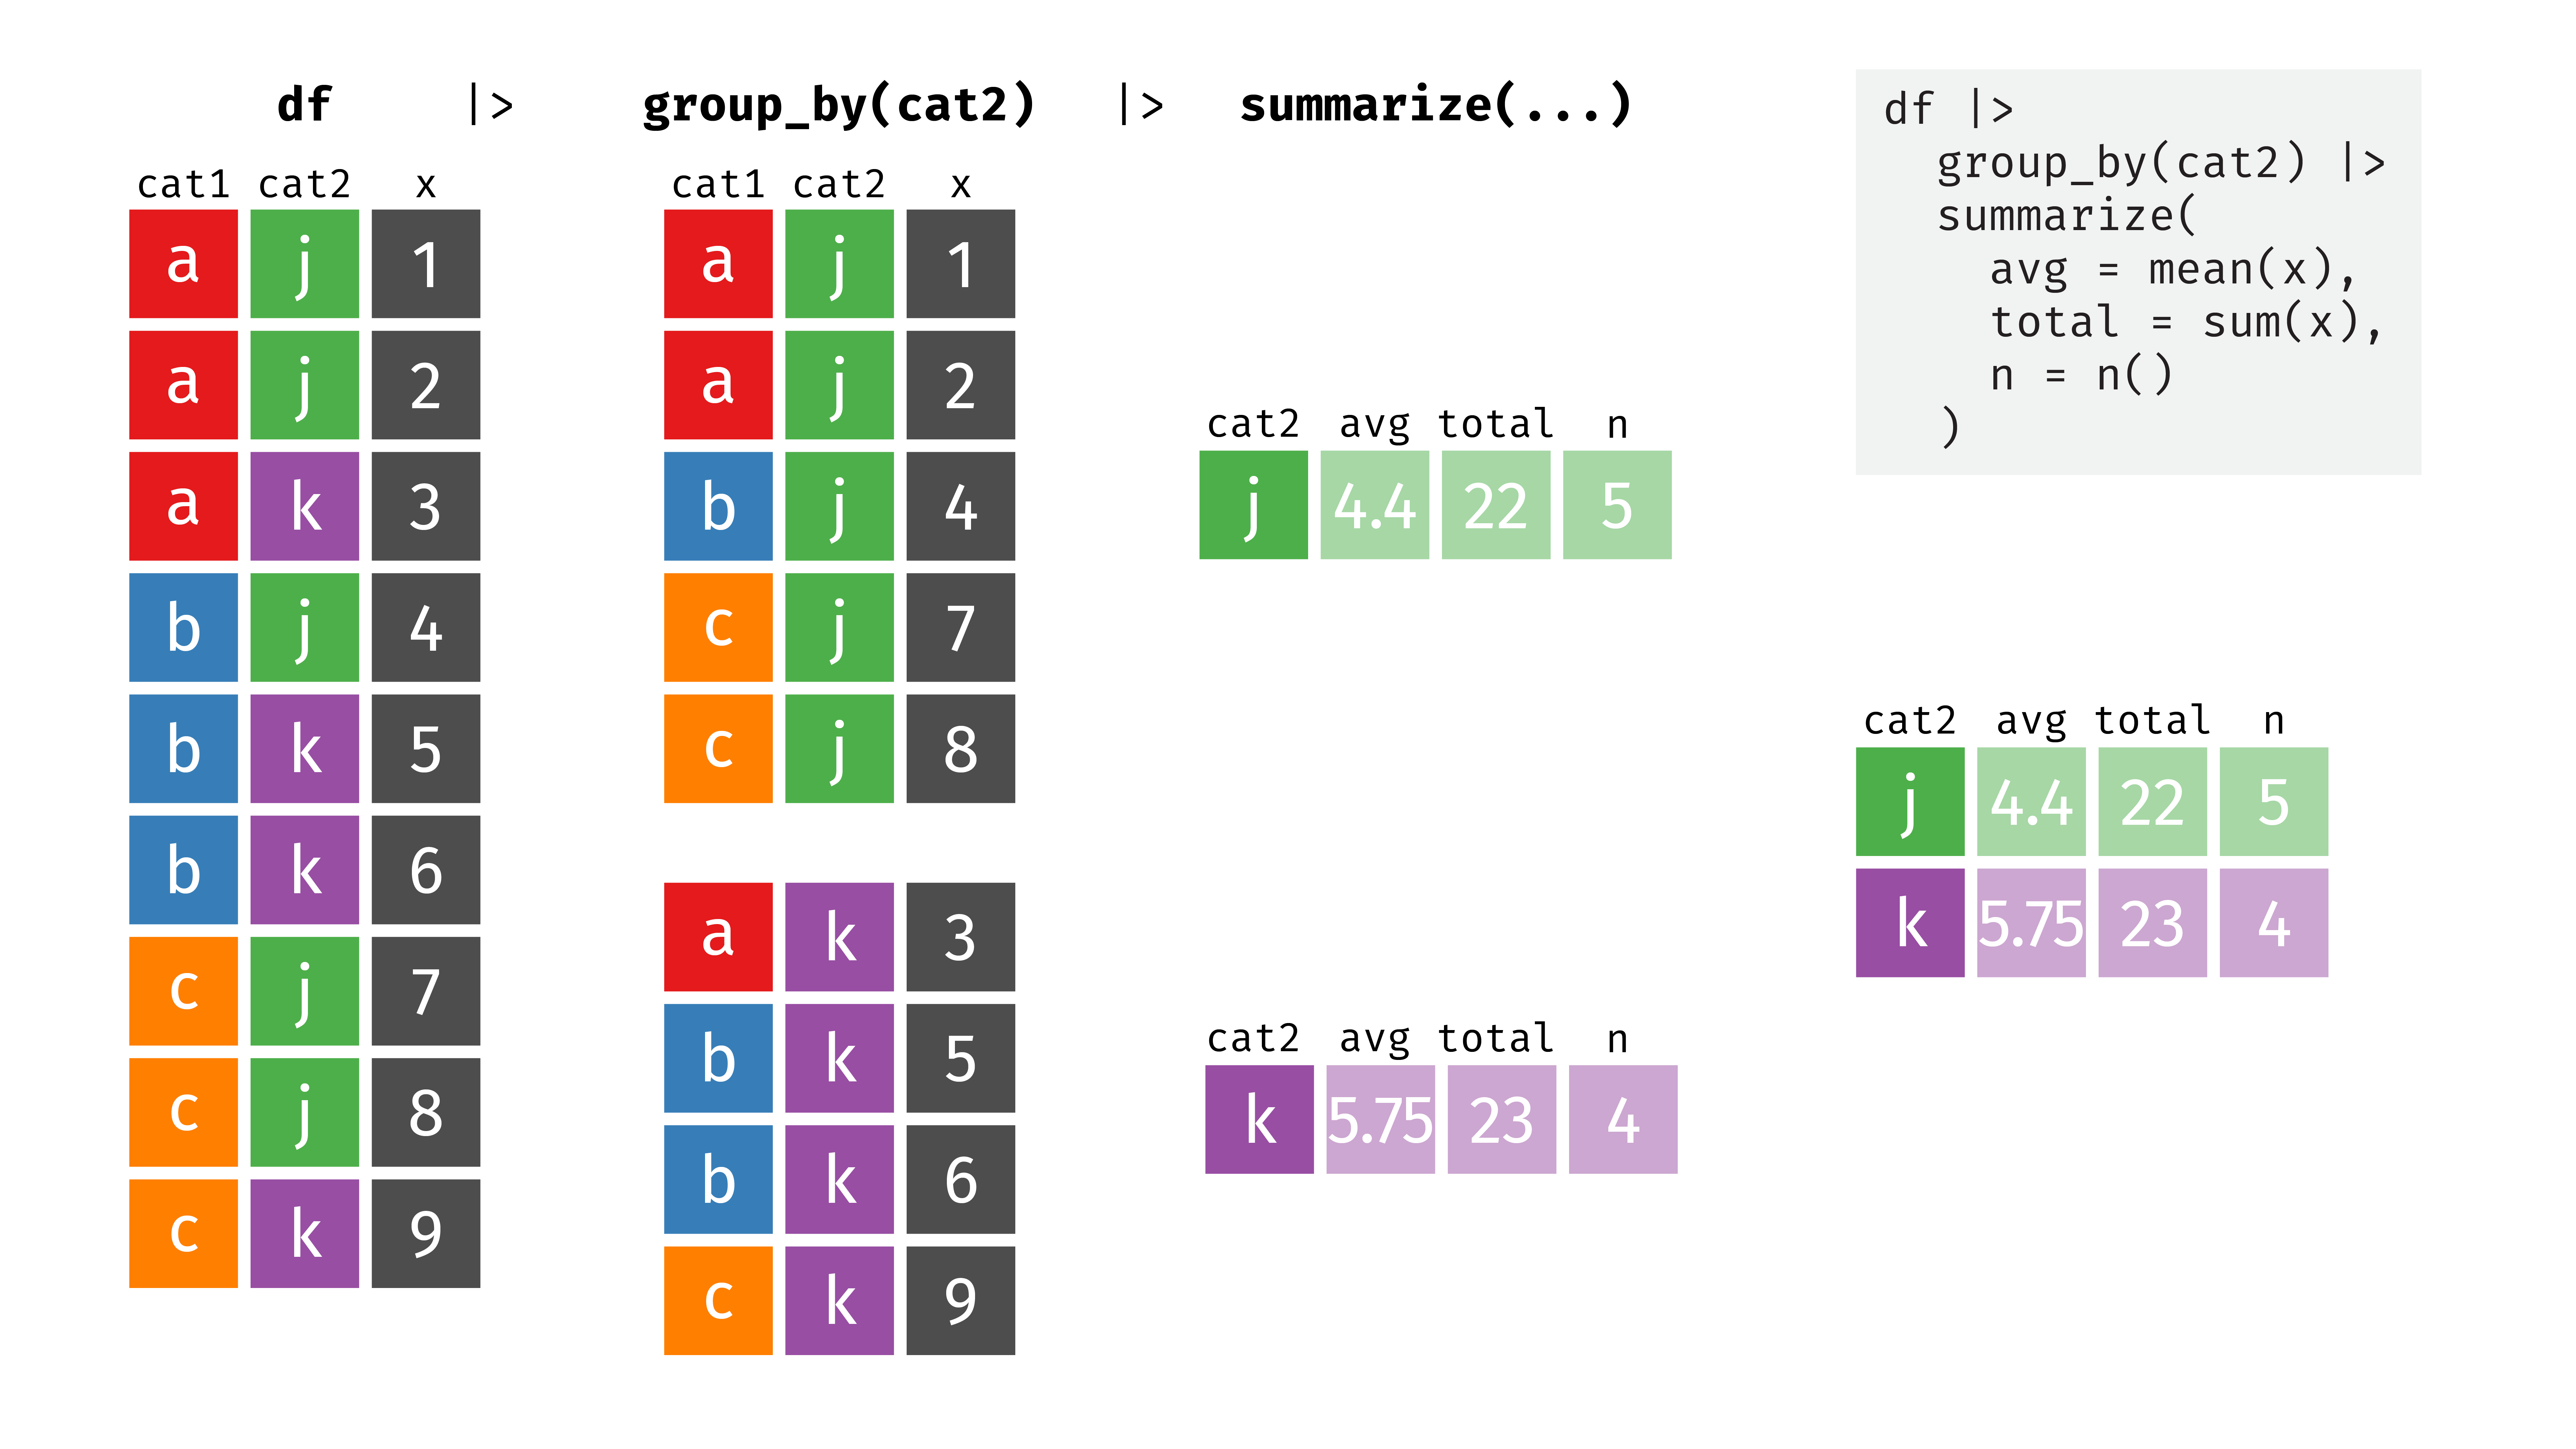
I’ve used Garrick Aden-Buie’s tidyexplain animations since he first made them in 2018. They’re incredibly useful for teaching—being able to see which rows left_join() includes when merging two datasets, or which cells end up where when pivoting longer or pivoting wider is so valuable.

Published

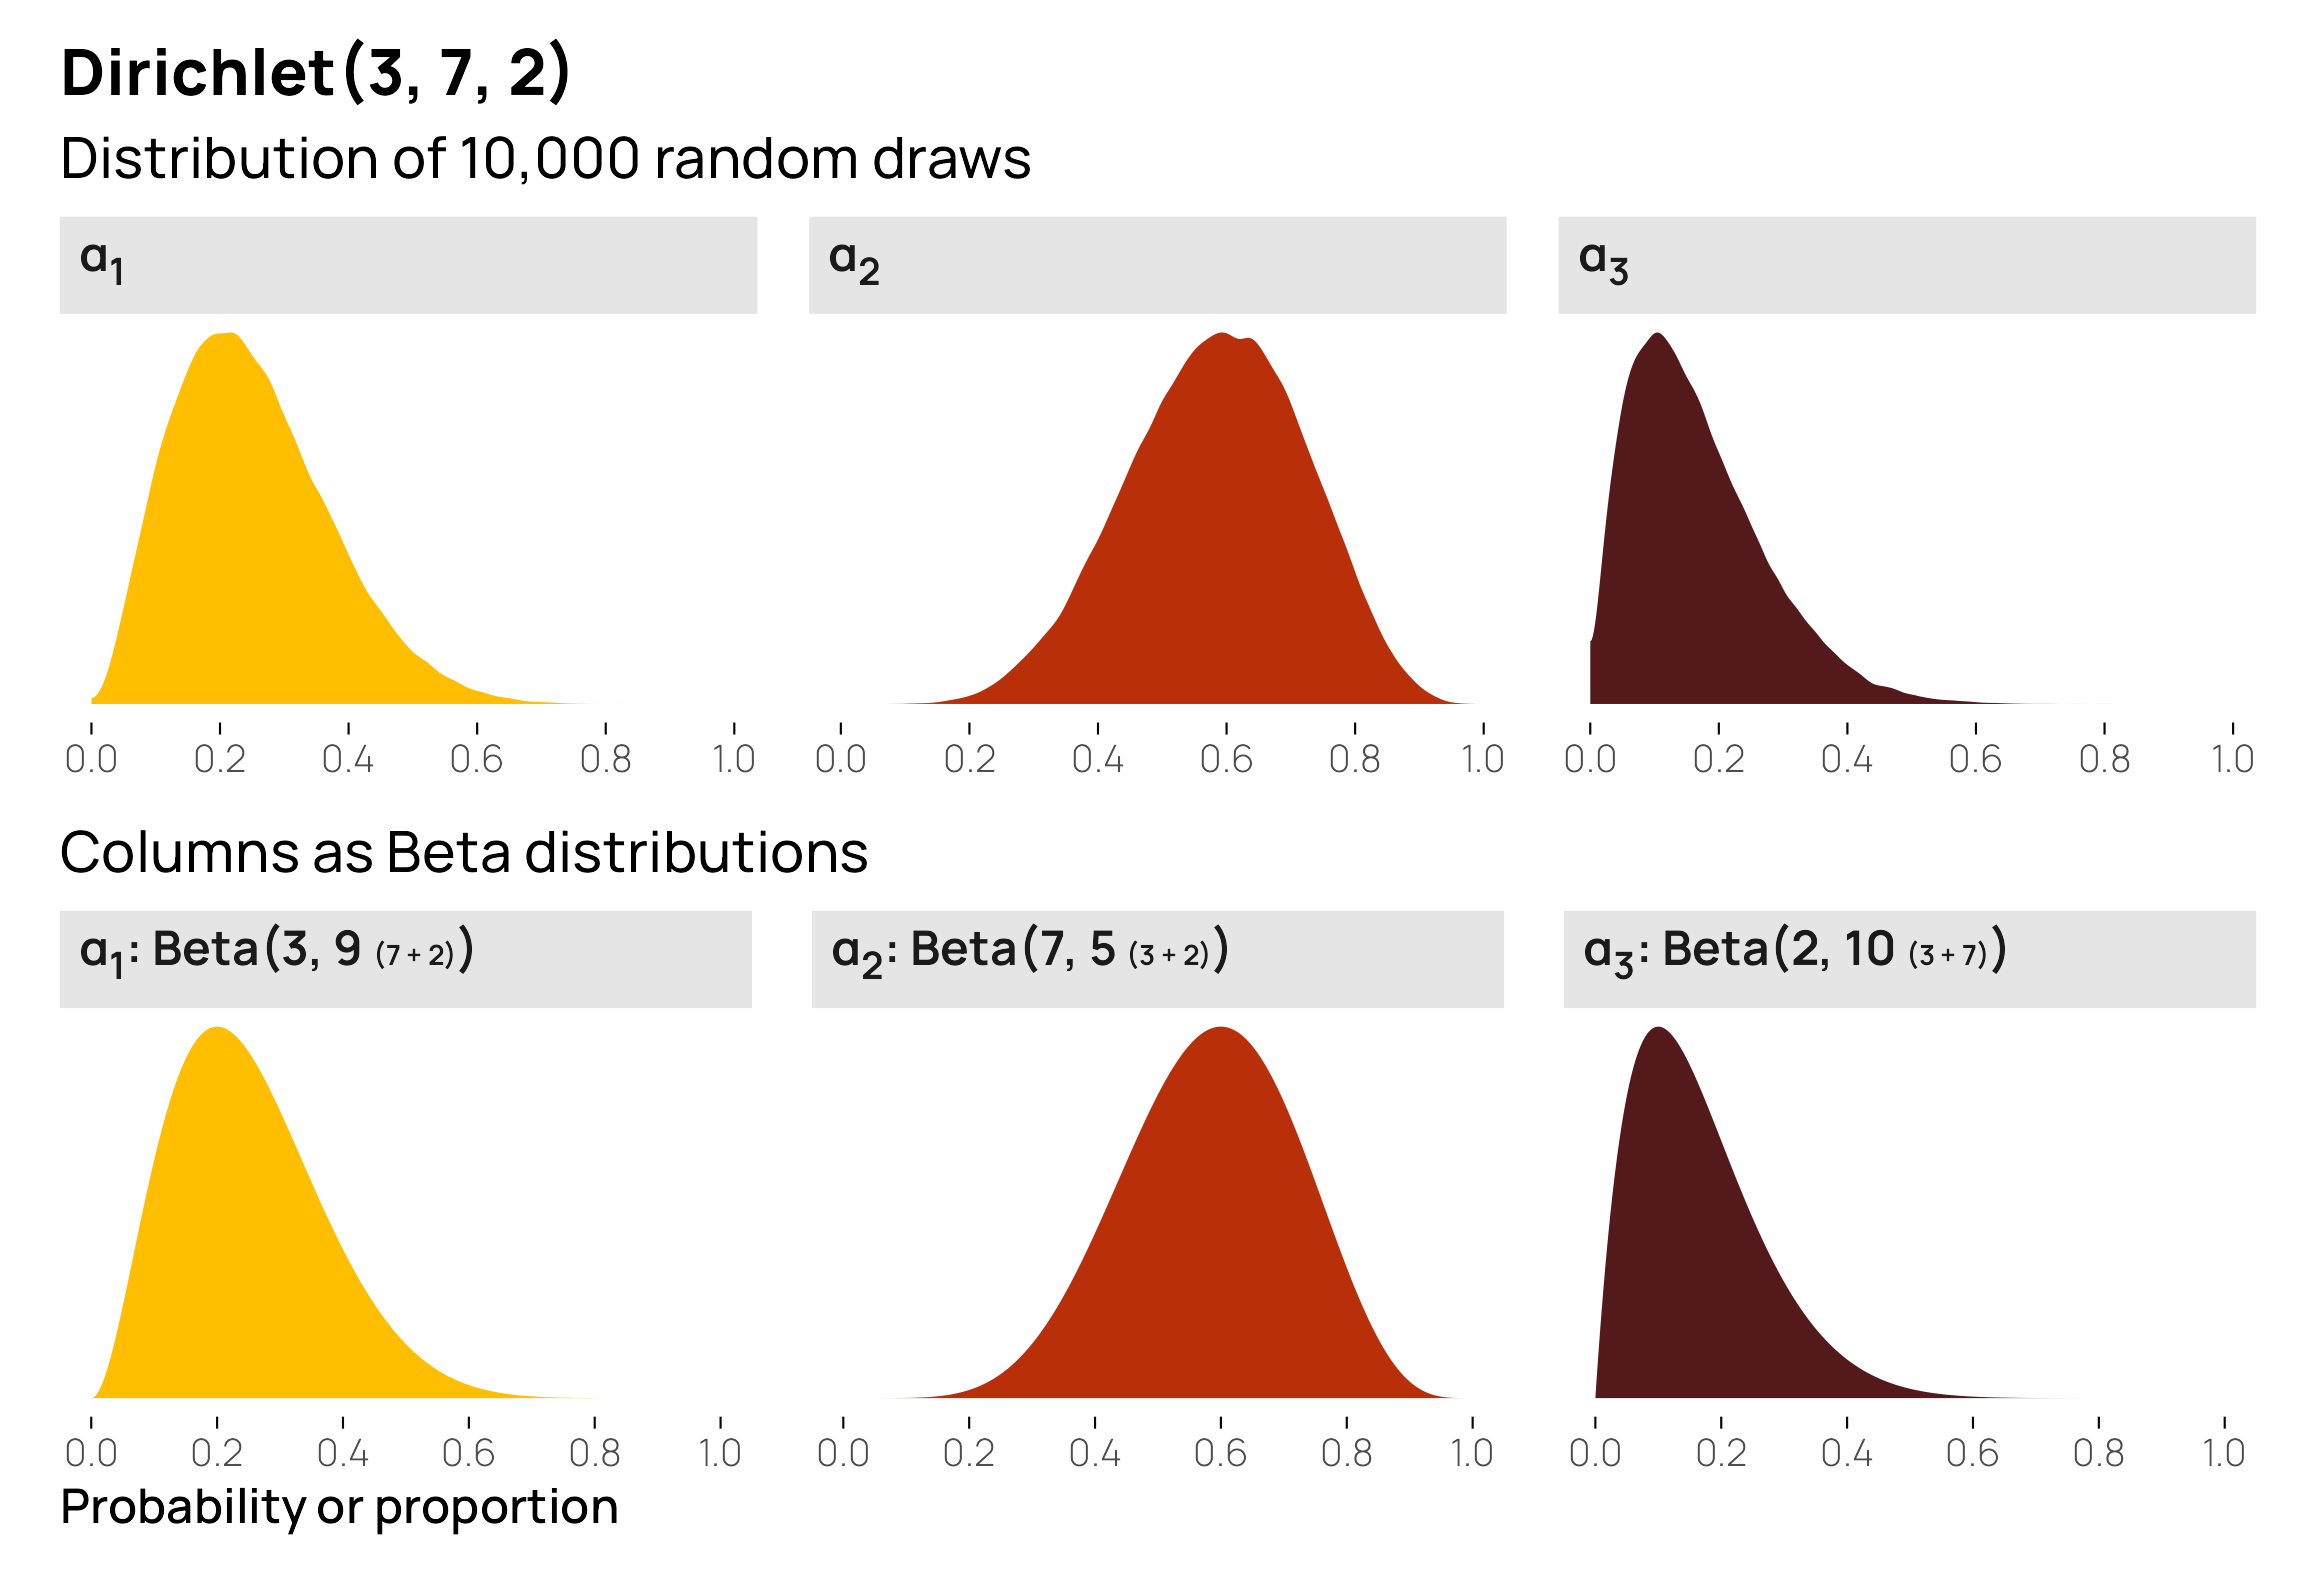
I’ve been finishing up a project that uses ordered Beta regression (Kubinec 2022), a neat combination of Beta regression and ordered logistic regression that you can use for modeling continuous outcomes that are bounded on either side (in my project, we’re modeling a variable that can only be between 1 and 32, for instance). It’s possible to use something like zero-one-inflated Beta regression for outcomes like this, but that kind of model

Published

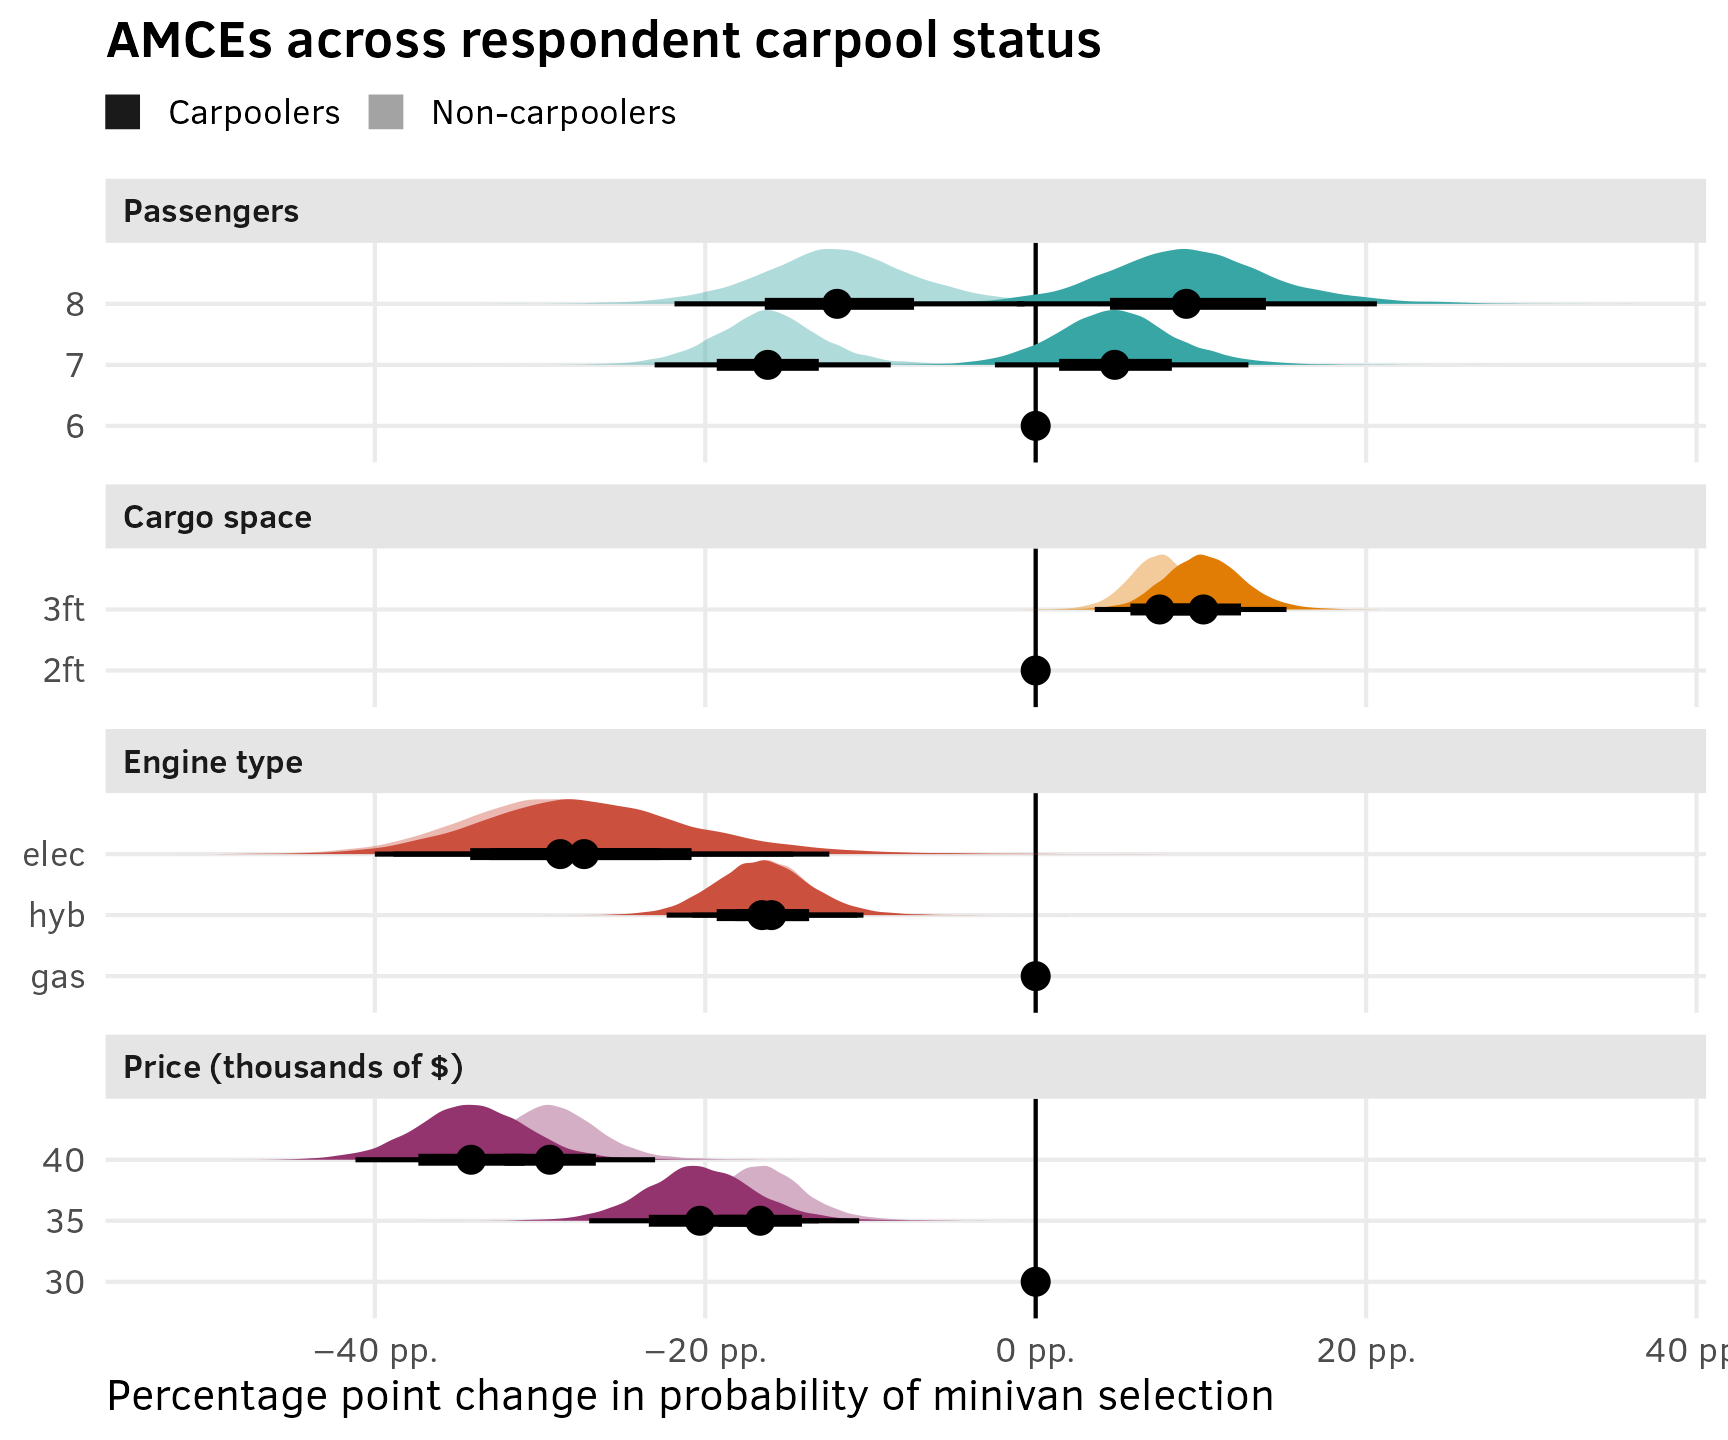
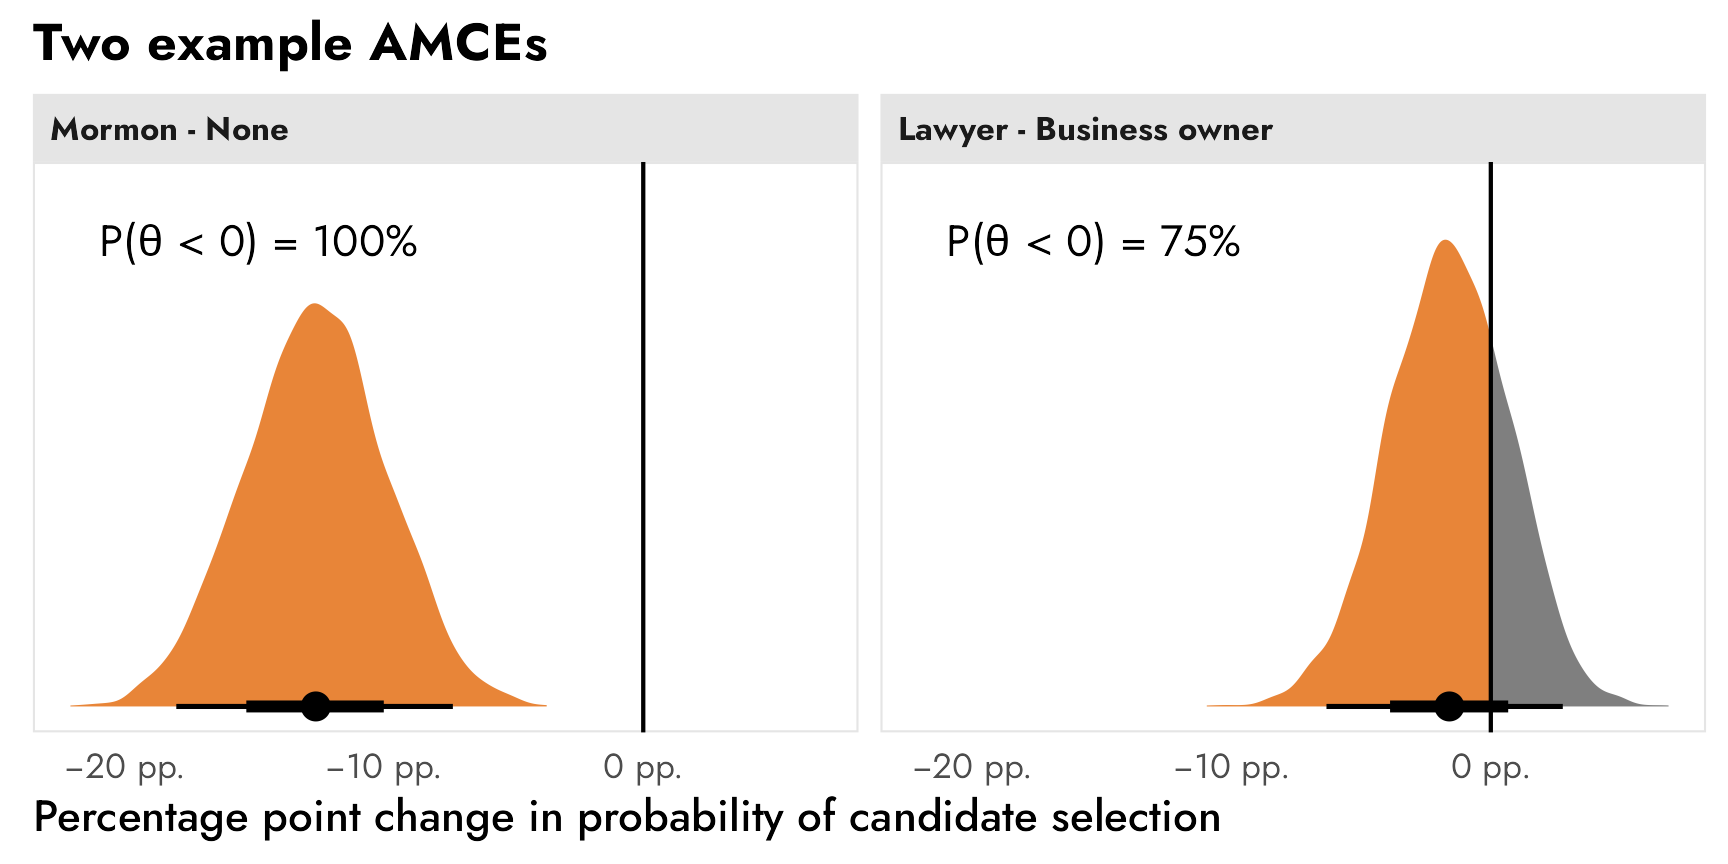
I recently posted a guide (mostly for future-me) about how to analyze conjoint survey data with R. I explore two different estimands that social scientists are interested in—causal average marginal component effects (AMCEs) and descriptive marginal means—and show how to find them with R, with both frequentist and Bayesian approaches. However, that post is a little wrong. It’s not wrong wrong, but it is a bit oversimplified.

Published

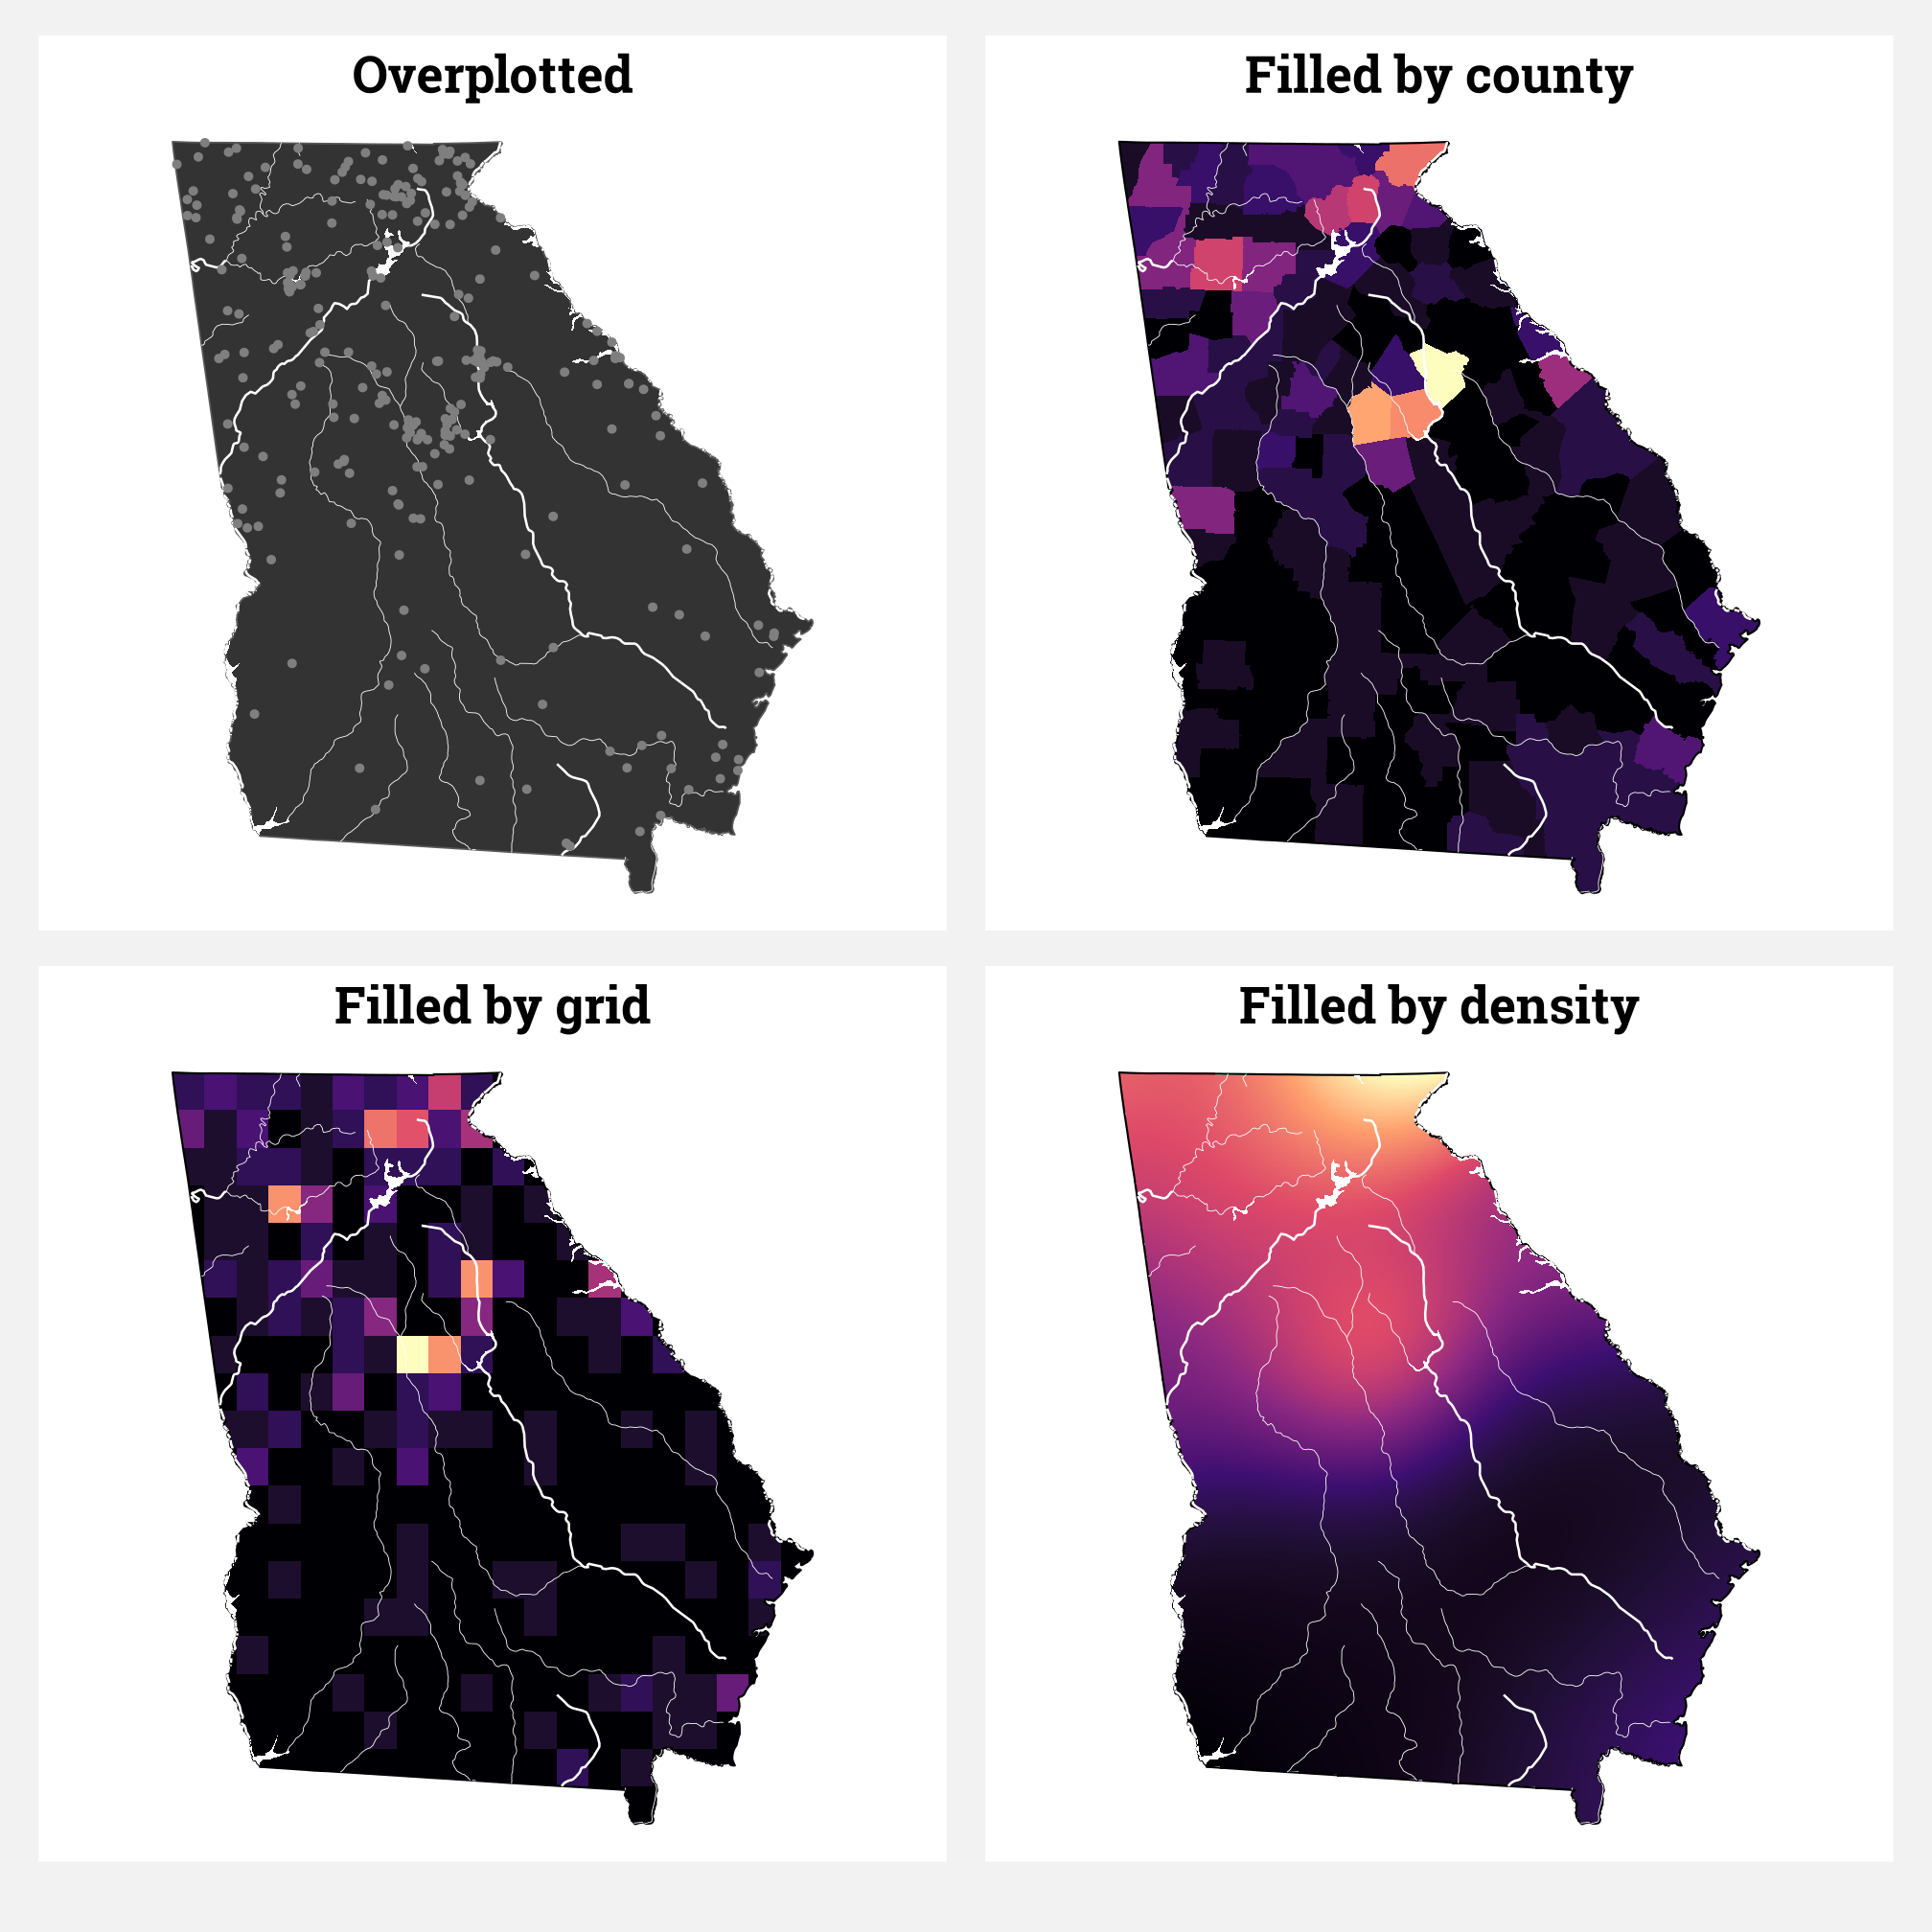
The students in my summer data visualization class are finishing up their final projects this week and I’ve been answering a bunch of questions on our class Slack. Often these are relatively standard reminders of how to tinker with specific ggplot layers (chaning the colors of a legend, adding line breaks in labels, etc.), but today one student had a fascinating and tricky question that led me down a realy fun dataviz rabbit hole.

Published

In my research, I study international nongovernmental organizations (INGOs) and look at how lots of different institutional and organizational factors influence INGO behavior. For instance, many authoritarian regimes have passed anti-NGO laws and engaged in other forms of legal crackdown, which has forced NGOs to change their programming strategies and their sources of funding.